Intraday forecast basic currencies rates; services of the personal analytical support; partner mutual relations.
середа, 21 лютого 2018 р.
GBPUSD intraday forecast (technical side) 2018-02-22
Estimates for today:
resistance (R1 / R2 / R3 = 1.39798 / 1.40044 / 442),
Support (S1 / S2 / S3 = 1.39002 / 1.38756 / 358).
The key resistance levels (1 st from 1.39863 to 1.39552 at the end of the day, 2nd from 1.39893 to 1.39632).
The OsMa indicator marked the increase in the activity of the pages with the preponderance of the bears.
Given the state of the Stochastics oscillators, expect a test (S1, S2, up H4), where it is recommended to consider the activity of the parties in the charts of smaller timeframes.
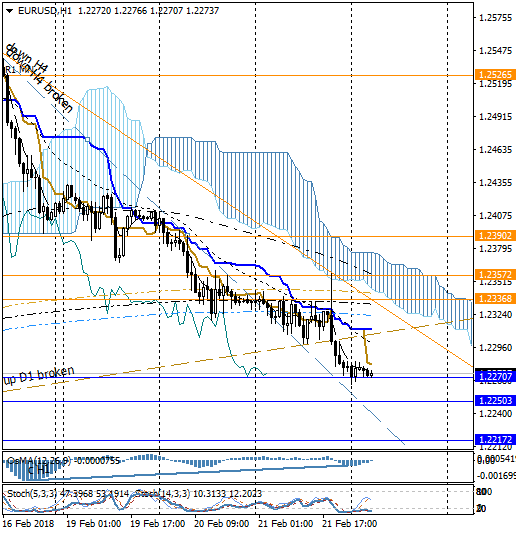
EURUSD intraday forecast (technical side) 2018-02-22
Settlement levels today:
resistance (R1 / R2 / R3 = 1.223368 / 572/902),
Support (S1 / S2 / S3 = 1.22707 / 503/172).
The key resistance levels (1 st from 1.23530 to 1.23157 at the end of the day, 2nd from 1.23768 to 1.23419).
OsMaI confirmed the divergence and noticed the decrease in the bears' activity, which provides the basis for the planning of trade corrections.
Given the state of the Stochastics oscillators, expect a level test (S1), where it is recommended to consider the activity of the parties on the charts of smaller timeframes.
USDCHF intraday forecast (technical side) 2018-02-22
Calculation levels:
resistance (R1 / R2 / R3 = 0.93952 / 0.94079 / 286),
Support (S1 / S2 / S3 = 0.93539 / 412/206).
Key support levels (1 st from 0.93410 to 0.93687 at the end of the day, 2nd from 0.93151 to 0.93392).
The OsMa indicator has confirmed the divergence and the decline of the bulls' activity at break (up H1 broken), which is the basis for the planning of trading transaction corrections for today.
Given the state of the OB oscillators of Stochastics, we expect a test of the levels (EMA522, R1, R2,, up H1 broken), where it is recommended to consider the activity of the parties in the charts of smaller timeframes.
USDJPY intraday forecast (technical side) 2018-02-22
Calculation levels:
resistance (R1 / R2 / R3 = 107.816 / 961 / 108.195),
Support (S1 / S2 / S3 = 107,348 / 203 / 106,969).
Key support levels (1 st from 107.081 to 107.584 at the end of the day, 2nd from 106.727 to 107.212).
The OsMa indicator has confirmed the divergence and the growth of the bearer's activity, which provides a basis for the planning of trading transaction correction to date.
Given the state of the Stochastics oscillators, expect a test (EMA23 / key support levels / S1 / S2 / EMA120), where it is recommended to consider the activities of the parties in the charts of smaller timeframes.
Підписатися на:
Коментарі (Atom)


