ANALYSIS & FORECAST:
#BRENT
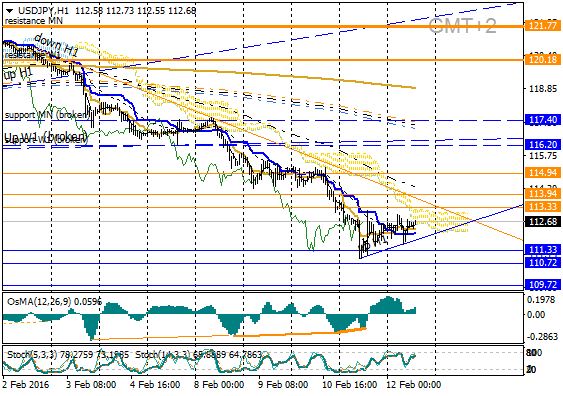
Розрахункові
рівні на сьогодні:
підтримки (S1/S2/S3=33,50/33,22/32,75), опору (R1/R2/R3=34,43/34,71/35,17).
Ключові
рівні (1-й від 32,03 до 33,35 в кінці
дня, 2-й від 31,79 до 32,28).
Корекційне
ростання та тест down
D1 закінчилося пробиттям
вище R1-w, R2,R3 . Індикатор OsMa відмітив дивергенцію
та зниження активності волів, що надає перевагу для планування торгових
операцій продажів сьогодні.
Враховуючи стан
OB осциляторів Stochastics, очікуємо
тест рівнів R3 та (up H1), де й рекомендовано розглянути активність сторін на
графіках менших таймфреймів.
Для
короткострокових продажів, при умові формування сигналів розвороту від рівнів
(R3) в разі цільовими
рівнями розрахункові рівні up H1,S1, а пробою до S2,S3, S1-m .
Для
альтернативних покупок корекції, при умові формування сигналів розвороту від рівнів
(EMA120, up H1, S1) та зростання курсу
цілями є рівні R1,R1-w, а апм умові пробою до R2,R3, EMA1440.
DetailedStatement:
Riston Capital Ltd.
|
Account: 338557
|
Name: Oleksandr Bilokon
|
Currency: USD
|
2016 February 20,
10:40
|
|
Closed Transactions:
|
|
|
Ticket
|
Open Time
|
Type
|
Size
|
Item
|
Price
|
S / L
|
T / P
|
Close Time
|
Price
|
Commission
|
Taxes
|
Swap
|
Profit
|
|
17820535
|
2016.02.16 10:14:35
|
balance
|
Deposit
|
10 000.00
|
|
17820616
|
2016.02.16 10:20:08
|
sell
|
5.00
|
#brent
|
35.79
|
36.80
|
33.63
|
2016.02.16 15:42:47
|
33.63
|
0.00
|
0.00
|
0.00
|
10 800.00
|
|
|
0.00
|
0.00
|
0.00
|
10 800.00
|
|
Closed P/L:
|
10 800.00
|
|
Open Trades:
|
|
Ticket
|
Open Time
|
Type
|
Size
|
Item
|
Price
|
S / L
|
T / P
|
|
Price
|
Commission
|
Taxes
|
Swap
|
Profit
|
|
No transactions
|
|
|
|
0.00
|
0.00
|
0.00
|
0.00
|
|
|
Floating P/L:
|
0.00
|
|
Working Orders:
|
|
Ticket
|
Open Time
|
Type
|
Size
|
Item
|
Price
|
S / L
|
T / P
|
Market Price
|
|
|
No transactions
|
|
|
|
|
Summary:
|
|
Deposit/Withdrawal:
|
10 000.00
|
Credit Facility:
|
0.00
|
|
|
Closed Trade P/L:
|
10 800.00
|
Floating P/L:
|
0.00
|
Margin:
|
0.00
|
|
Balance:
|
20 800.00
|
Equity:
|
20 800.00
|
Free Margin:
|
20 800.00
|
|
|
|
Details:
|
|
|
|
Gross Profit:
|
10 800.00
|
Gross Loss:
|
0.00
|
Total Net Profit:
|
10 800.00
|
|
Profit Factor:
|
|
Expected Payoff:
|
10800.00
|
|
|
Absolute Drawdown:
|
0.00
|
Maximal Drawdown:
|
0.00 (0.00%)
|
Relative Drawdown:
|
0.00% (0.00)
|
|
|
|
Total Trades:
|
1
|
Short Positions
(won %):
|
1 (100.00%)
|
Long Positions (won
%):
|
0 (0.00%)
|
|
Profit Trades (% of
total):
|
1 (100.00%)
|
Loss trades (% of
total):
|
0 (0.00%)
|
|
Largest
|
profit trade:
|
10 800.00
|
loss trade:
|
0.00
|
|
Average
|
profit trade:
|
10 800.00
|
loss trade:
|
0.00
|
|
Maximum
|
consecutive wins
($):
|
1 (10 800.00)
|
consecutive losses
($):
|
0 (0.00)
|
|
Maximal
|
consecutive profit
(count):
|
10 800.00 (1)
|
consecutive loss
(count):
|
0.00 (0)
|
|
Average
|
consecutive wins:
|
1
|
consecutive losses:
|
0
|
AFTER
THET: