weekly forecast (technical side)

GBPUSD weekly forecast (technical side) 2018-06-(11-15)

суботу, 30 квітня 2016 р.

EURUSD D1 (monthly analysis 2016-04)

EURUSD 

 Analysis (Monthly):
Last month the couple began 1.1378 (Open) with testing monthly calculated level of resistance 1.1429 (R1-m) to a mark 1.1464 (High), then was made the expected pullback down to (EMA24, middle od Up W1 channel, Down W1 broken). Alternative short positions of (R1-m) to (Down W1 broken) implemented.
Further growth of the lack of activity was suspended bulls and the course again dropped to 1,1217 (Low), then a sharp increase and continuation of penetration rollback formed. (Down H4) and the calculated resistance R1-m implemented plans of long positions in marks the end of mhsyatsya 1yu1458 and 1.1451 (Close).

вівторок, 26 квітня 2016 р.

USDJPY intraday forecast (technical side) 2016-04-26


-Calculated data levels:
Support (S1 / S2 / S3 = 111,04 / 111,90 / 110,66), resistance (R1 / R2 / R3 = 111,68 / 92 / 112.31).
Key level (1st from 110.53 to 110.55 at the end of the day, the 2nd of 110.84 to 111.21).
Indicator OsMa krverhentsiyu noted that there is a basis for planning of trading correction.

More details of analysis & forecast : 

or through personal appeal (bi0l@meta.ua)

GBPUSD intraday forecast (technical side) 2016-04-26


Calculated level for today:
 Support (S1 / S2 / S3 = 1,4511 / 39/83), resistance (R1 / R2 / R3 = 1,4423 / 1,4395 / 51).
Key support levels (1st from 1.4396 to 1.4470 late in the day, the 2nd of 1.4375 to 1.4415).
OsMa marked divergence indicator to breakdown levels (S1-m, S1, S2), which provides the basis for planning of trading correction.

More details of analysis & forecast : 

or through personal appeal (bi0l@meta.ua)

USDCHF intraday forecast (technical side) 2016-04-26


Estimated level:
Support (S1 / S2 / S3 = 0,9736 / 0,9723 / 0,9702), resistance (R1 / R2 / R3 = 0,9779 / 92 / .9802).
Key level (1st from 0.9721 to 0.9752 late in the day, the 2nd of 0.9767 to 0.9756).
OsMa marked divergence indicator and reduced activity of the parties, which is the basis for planning of trading operations benefit from correction of shopping today.

More details of analysis & forecast : 
or through personal appeal (bi0l@meta.ua)

EURUSD intraday forecast (technical side) 2016-04-26


Calculated levels today:
Support (S1 / S2 / S3 = 1,1232 / 18 / 1.1196) and resistance (R1 / R2 / R3 = 1.1277 / 91 / 1.1314).
Key level (1st from 1.1256 to 1.1254 late in the day, the 2nd of 1.1307 to 1.1263).
Indicator OsMa noted reduced activity of bulls, which provides a basis for planning trading operations for today correction.

More details of analysis & forecast : 

or through personal appeal (bi0l@meta.ua)

XAUUSD intraday forecast (technical side) 2016-04-26

Calculated level for today:
Support (S1 / S2 / S3 = 1231,94 / 1229,06 / 1224,38), resistance (R1 / R2 / R3 = 1241,29 / 1244,17 / 1248,84).
Key resistance levels (1st from 1238.75 to 1235.80 at the end of the day 2nd - 1248.68).
Indicator OsMa marked increase in activity bears, which is the basis for planning trading operations for today correction.
\
More details of analysis & forecast : 
or through personal appeal (bi0l@meta.ua)


#BRENT intraday forecast (technical side) 2016-04-26


Calculated level for today:
Support (S1 / S2 / S3 = 44,24 / 43,96 / 43,49), resistance (R1 / R2 / R3 = 45,18 / 45,46 / 45,92).
Key resistance levels (1st from 44.30 to 44.86 at the end of the day, the 2nd of 45.01 to 45.05).
Indicator OsMa noted reduced activity of the parties, which provides a basis for planning of trading operations benefit from correction and decline today.

More details of analysis & forecast : 
or through personal appeal (bi0l@meta.ua)


понеділок, 25 квітня 2016 р.

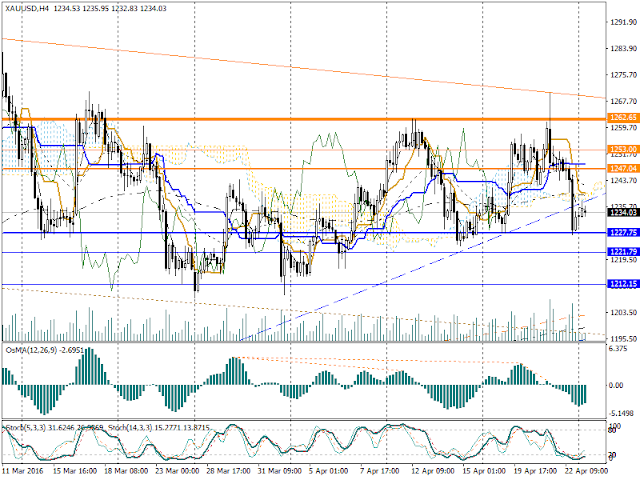
XAUUSD weekly forecast 2016-04-week4

Estimated levels of the week:
Support (S1-w / S2 / S3 = 1227,75 / 1221,79 / 1212,15), resistance (R1-w / R2 / R3 = 1247,04 / 1253,00 / 1262,64).
Key resistance levels (1st from 1238.37 to 1244.26 at the end of the week, 2nd from 1239.71 to 1246.93).
Indicator OsMa marked increase in activity bears the sample (up H4 broken), which is the basis for planning of trading correction.

More details of analysis & forecast : 
or through personal appeal (bi0l@meta.ua)

#BRENT weekly forecast 2016-04-week4

Estimated levels of the week:
Support (S1-w / S2 / S3 = 41,76 / 40,48 / 38,41), resistance (R1-w / R2 / R3 = 45,90 / 47,18 / 49,25).
Key support levels (1st from 42.45 to 44.58 in the week, 2nd from 41.59 to 43.22).
Indicator OsMa marked decrease in activity at the end of bulls and divergence, which provides a basis for planning of trading correction dominated sales.

More details of analysis & forecast : 
or through personal appeal (bi0l@meta.ua)

неділю, 24 квітня 2016 р.

XAUUSD weekly analysis (2016-04-week3)

Flat last week. There was the expected growth of (S1-w), with the correction trend (up H4 broken), then from the breakdown of key levels to weekly resistance levels (R1-w) and the (R1-m) to the test and subsequent return below key levels and breakdown (up H4 broken) almost (S1-w) ..

More details of analysis & forecast : 
or through personal appeal (bi0l@meta.ua)

#BRENT weekly analysis 2016-04-week3

(Gap - 52p) opening last week with a test of key support levels provided power further growth breakdown (middle of u H4 channel) to (down H4 broken), returning to pullback to the (middle of u H4 channel) and growth of breakdown weekly levels resistance (R1-w). (up H1 channel) is formed .

More details of analysis & forecast : 
or through personal appeal (bi0l@meta.ua)

USDJPY weekly analysis 2016-04-week3

Last week opened with (gap - 52p) with a test weekly support levels (S1-w), that gave power to further increase to (down H4 broken, R1-w) of the test and breakdown weekly resistance levels (R1-w) above key levels and (down D1) for levels (Up W1 broken). Zformovano (up H4 channel).

More details of analysis & forecast : 
or through personal appeal (bi0l@meta.ua)

USDCHF weekly analysis 2016-04-week3

Over the past week testing levels (down D1 broken) was delayed and led to the depreciation of the key support levels. Breakdown (down D1 broken, R1-w, middle of Up H4 channel) exhausted oxen activity and further growth was suspended from the sharp decline to the cluster (EMA120,24). Further extension RALY bulls the upper levels prevailing channel (Up H4 channel). 

More details of analysis & forecast : 
or through personal appeal (bi0l@meta.ua)

GBPUSD weekly analysis 2016-04-week3


The test key levels completed growth rate of breakdown levels (R1-w, Down D1 broken channel, middle of Up D1 channel) to trend (down W1), and the return rate to fall back to levels (Down D1 broken channel) followed by Renji correction in around these levels (middle of Up D1 channel).

More details of analysis & forecast : 

or through personal appeal (bi0l@meta.ua)

EURUSD weekly analysis 2016-04-week3


The expected pullback from the (Down W1 broken channel) with testing key resistance levels formed (up H4), but the activity of bulls was spent on overcoming (EMA120) and key levels and not enough growth to the calculation of weekly and monthly resistance levels (R1-w, R1-m). By reducing the rate of the 3rd point of the trend (up H4) initiative intercepted the other side, leading to a breakdown (up H4 broken) to the next milestone (middle of Up W1 channel). Then there was an unsuccessful attempt to revenge bulls formed () with its correction and return to course down (Down W1 broken channel).

More details of analysis & forecast : 

or through personal appeal (bi0l@meta.ua)

неділю, 17 квітня 2016 р.

#BRENT weekly analysis 2016-04-week2

Analysis (Weekly):
Last week there was a growth rate of (middle of up H4 channel) with a breakdown of weekly and monthly resistance levels (R1-w, R1-m) with an attempt to return to a breach (Historical Up MN broken), and again decrease to (R1-w , R1-m, middle of u H4 channel).

More details of analysis & forecast : 

XAUUSD weekly analysis (2016-04-week2)


Analysis (Weekly):
Last week was the expected growth of rollback (down H4 broken) breakdown of weekly resistance levels (R1-w) to (R1-m) and subsequent return below key levels and breakdown (up H4 broken).

More details of analysis & forecast : 

USDJPY weekly analysis (2016-04-week2)

Analysis (Weekly):
Last week correction of growth (middle of Down D1 channel) and weekly resistance levels (S1-w) to key resistance levels complete breakdown (down H4), and suspended testing 1-key levels.

More details of analysis & forecast : 

USDCHF weekly analysis (2016-04-11/15)


Analysis (Weekly):
Last week the expected growth of rollback (Down MN broken channel), weekly and monthly resistance levels (S1-m, S1-w) to R1-w and key resistance levels complete breakdown, and stopped testing levels (EMA120).

More details of analysis & forecast : 

GBPUSD weekly analysis (2016-04-11/15)


Analysis (Weekly):
The growth of (Yp D1 channel), monthly and weekly resistance levels (S1-m, S1-w) to key support levels that began 6/4/2016, last week completed the breakdown of key levels, test middle channel (middle of Up D1 channel) and the return rate of the borders to key levels (EMA120).

More details of analysis & forecast : 

EURUSD weekly analysis (2016-04-11/15)


Analysis (Weekly):
Expected Flat with testing the estimated monthly resistance levels (R1-m), trend (up H4), and key support levels that started in early April, last week completed breakdown (up H4) and the return rate to the (Down W1 broken channel) .

More details of analysis & forecast : 

середу, 13 квітня 2016 р.

EURUSD intraday forecast (technical side) 2016-04-13


Calculated levels today:
Support (S1 / S2 / S3 = 1,1352 / 23 / 1.1278) and resistance (R1 / R2 / R3 = 1.1443 / 72 / 1.1518).
Key resistance levels (1st from 1.1397 to 1.1392 late in the day, the 2nd of 1.1412 to 1.1404).
Indicator OsMa marked increase in activity bears the sample levels (up H4 broken), which provides the basis for planning of trading correction advantage of sales to date.

More details of analysis & forecast : 

XAUUSD intraday forecast (technical side) 2016-04-13

Calculated level for today:
Support (S1 / S2 / S3 = 1251,60 / 1249,15 / 1244,75), resistance (R1 / R2 / R3 = 1260,67 / 1263,39 / 1267,79).
Key level (1st from 1250.57 to 1256.69 at the end of the day, the 2nd of 1244.01 to 1247.61).
Indicator OsMa marked increase in activity bears the sample (up H4 broken), which is the basis for planning trading operations for today correction.

More details of analysis & forecast : 


#BRENT intraday forecast (technical side) 2016-04-13


Calculated level for today:
Support (S1 / S2 / S3 = 42,99 / 42,48 / 41,44), resistance (R1 / R2 / R3 = 44,67 / 45,18 / 46,02).
Key resistance levels (1st from 42.06 to 43.52 at the end of the day, the 2nd of 40.86 to 42.29).
Indicator OsMa marked increase in activity of bulls in late day trading and divergence, which provides a basis for planning of trading operations for today and correction.

More details of analysis & forecast : 

пʼятницю, 1 квітня 2016 р.

EURUSD D1 (monthly analysis & forecast)

Analysis:
Last month, the couple started Open (1.0880) with testing (Down W1 broken channel), then was made up of the expected pullback correction (Up W1 channel), a sharp decrease of EMA120 to Low (1,0821) and rollback continuation of settlement penetration resistance S1-m level to High (1,1411) and Close (1,1269).

Forecast:
Calculated monthly level:
Support (S1-m / S2 / S3 = 1.0978 / 1.0839 / 1.0614), resistance (R1-m / R2 / R3 = 1.1429 / 1.1568 / 1.1794).
Key support levels (1st from 1.1090 to 1.1200 late in the day, 2nd 1, 1043 to 1.1100).
The pair is adjusted upward channel Up W1 channel (from 1.0895 to 1.1022).
Trending indicators Ichimoku, EMA24, EMA120 indicate the general direction of movement UP-quotations.

More details of analysis & forecast :