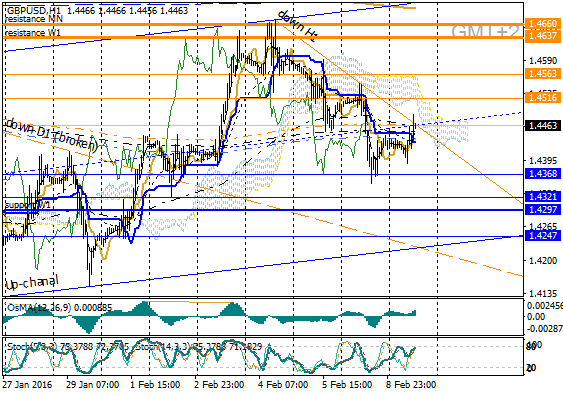
Support (S1 / S2 / S3 = 1,1035 / 85 / 1.1115) and resistance (R1 / R2 / R3 = 1,1214 / 44/93).
Key level (1st from 1.11178 to 1.1166 late in the day, the 2nd of 1.1146 to 1.1151).
Growing activity Vedmezha side end of the last trading day that marked the indicator OsMa, did not change the overall technical picture that favors planning trading operations for today correction.
Given the state of the OS Stochastics oscillator, expect a test of key levels, and R1, R2, (up H1), where it is recommended to consider the activities of the parties on the charts of smaller timeframes.
For short-term sales on condition of formation of reversal signals R1 / R2, the target levels are calculated levels S1 / S2 / S3, and when breakdown to 1.0959 / 51 (Down W1 broken).
For alternative shopping, provided breakout above key levels, goals are equal R1 / R2 / R3.