Intraday forecast basic currencies rates; services of the personal analytical support; partner mutual relations.
понеділок, 12 лютого 2018 р.
USDCHF intraday forecast (technical side) 2018-02-13
Calculation levels:
support (S1 / S2 / S3 = 0.93658 / 599/454),
resistance (R1 / R2 / R3 = 0.93978 / 0.94067 / 212).
The key resistance levels (1 st from 0.93925 to 0.93776 at the end of the day, 2nd from 0.94083 to 0.93950).
The OsMa indicator marked a decline in the activity of the sites, which is the basis for the planning of trading breakdowns for today.
Given the state of Stochastics oscillators, we expect a test of levels (up H1, key resistance levels), where it is recommended to consider the activity of the parties on the charts of smaller timeframes.
Compiled according to the trading platform MT4 from AVATRDE.com
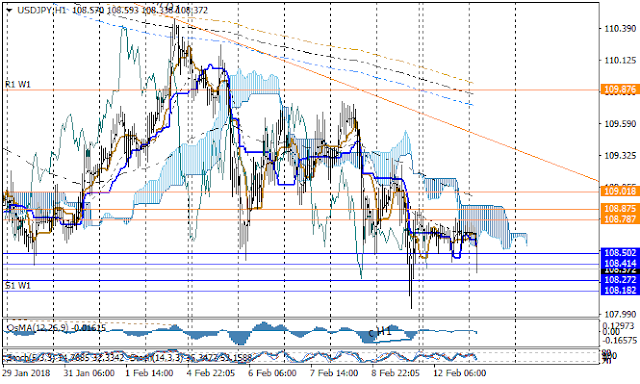
USDJPY intraday forecast (technical side) 2018-02-13
Calculation levels:
support (S1 / S2 / S3 = 108,502 / 414/272),
resistance (R1 / R2 / R3 = 108.787 / 875 / 109.018).
The key resistance levels (1 st from 108.602 to 108.635 at the end of the day, 2nd from 108.906 to 108.898).
The OsMa indicator marked a decline in the bear-side activity.
Given the neutral state of the Stochastics oscillators, expect a S2, S3, S1W1 test, where it is recommended to consider the activity of the parties on the charts of smaller timeframes.
Compiled according to the trading platform MT4 from AVATRDE.com
More details of analysis & forecast : https://www.mql5.com/en/users/bi0l/blog
USDJPY H4 weekly forecast (technical side) 2018-02-(12-16)
Estimated levels per week:
support (S1 / S2 / S3 = 108,182 / 107.659 / 106.812),
resistance (R1 / R2 / R3 = 109.876 / 110.399 / 111.246).
The key resistance levels (1 st from 109.373 to 108.255 at the end of the week, 2nd from 109.793 to 109.255).
The OsMa indicator marked a decline in the bear-side activity at the end of the last trading week.
Given the neutral state of the Stochastics oscillators, expect a test (EMA24, S1), where it is recommended to consider the activity of the parties in the charts of smaller timeframes.
For short-term sales, if the turn signals are formed from (EMA24), the goals are equal (S1, S2, S3).
An alternative to short-term purchases of corrections from (S1) with goals to levels (down D1), and if it goes above the key levels with goals (R1, R2, R3).
GBPUSD H4 weekly forecast (technical side) 2018-02-(12-16)
Estimated levels per week:
support (S1 / S2 / S3 = 1.37645 / 1.36735 / 1.35262),
resistance (R1 / R2 / R3 = 1.40592 / 1.41502 / 1.42976).
The key resistance levels (1 st from 1.41193 to 1.38947 at the end of the week, 2nd from 1.41610 to 1.40204).
The OsMa indicator marked a decline in the performance of the parties in the breakdown (up H4 broken), which provides a basis for planning trade transactions with a sales advantage.
Given the state of the Stochastics oscillators, we expect a test (up H4 broken, EMA24, EMA120), where it is recommended to consider the activity of the parties on the charts of smaller timeframes.
(Bear side). For sales positions on a rollover condition (down H1 / up H4 broken, down H4), targets may be equal (S1 / S2 / S3).
(Side of bulls). Alternative short-term purchases are meaningful when the levels of down (down H4) breakdowns with target-to-key resistance levels, or (R1).
Підписатися на:
Коментарі (Atom)


