weekly forecast (technical side)

GBPUSD weekly forecast (technical side) 2018-06-(11-15)

четвер, 31 травня 2018 р.

USDCHF intraday forecast (technical side) 2018-06-01

Calculation levels:
resistance (R1 / R2 / R3 = 0.98791 / 944 / 0.99191);
Support (S1 / S2 / S3 = 0.98297 / 144/897).
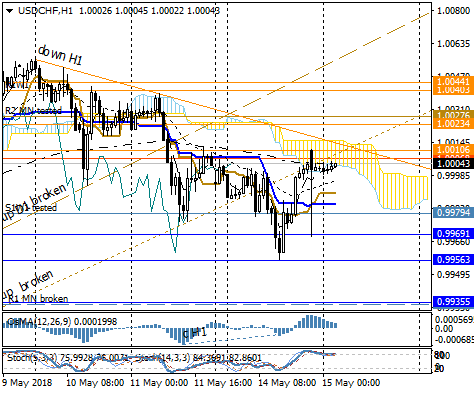
The key resistance levels (1 st from 0.98993 to 0.98509 at the end of the day, 2nd from 0.99160 to 0.98797).
The OsMa indicator marked the convergence of sellers' activity and the corresponding downward growth in downtime of buyers (down H1 broken), but also the OB factor factor.
Given the state of the OB oscillators of Stochastics, we expect a test of the levels (R1 / key resistance levels / R2 / EMA120), where it is recommended to consider the activities of the parties on the charts of smaller timeframes.

USDCHF monthly analysis (technical side) 2018-05

The last month started with the mark (Open 0.99076; gap +10) with breakdown above the calculated resistance levels (R1MN) and the test (R2MN) to (High 1.00552) with further downsizing, correction and breakdown of trends (up D1 broken / up D1 '' ' broken) to (Low 0.98251) and closing the month (Close 0.98484).

USDJPY intraday forecast (technical side) 2018-06-01

Estimated levels per day:
resistance (R1 / R2 / R3 = 108.938 / 109.083 / 317);
Support (S1 / S2 / S3 = 108,471 / 326/093).
Key support levels (1 st from 108,813 to 108,656 at the end of the day, 2nd from 108,782 to 108,633).
The OsMa indicator for the past month marked the convergence of sellers' activity, and the corresponding increase in the activity of buyers in the testing of key lacunae. at the end of the day. At the opening, the growth of customer activity on breakdowns (key breakdowns / down h4 broken / R1 / R2) continued. and a divergence of buyer activity was noted.
Given the state of the OB oscillators Stochastics, expect a test (R2 / EMA120), where it is recommended to consider the activity of the parties in the charts of smaller timeframes.

USDJPY monthly analysis (technical side) 2018-05

Last month started with the mark (Open 109.309; gap - 11) with the growth on opening to 110.026 (test R1MN / EMA522Low) with a further decrease to 108.639 (EMA120). Further growth correction (breakdown R1MN / test R2MN / EMA522High) to (High 111.386) corrected the trend (down W1). Further downgraded to 108.945 (EMA120 / up D1 correction), up to 109.819 (R1MN / EMA 24 test) and down to 1-key support levels (breakdown up D1 broken / EMA120) to (Low 105.649) and correctional growth course with the closure of the month (Close 108.740).

GBPUSD intraday forecast (technical side) 2018-05-31

Estimates for today:
resistance (R1 / R2 / R3 = 1.33018 / 171/419);
support (S1 / S2 / S3 = 1,32521 / 368/119).
Key support levels (1 st from 1.32718 to 1.32788 at the end of the day, 2nd from 1.32631 to 1.32639).
The OsMa indicator in the first half of the past day indicated an increase in loquers' activity at breakdowns of key levels, and at the end of the day, a slight increase in downside D1 / up H1 sales, which ended with a breakdown above (down D1 broken / R1 broken / R2 broken) at the opening today .
Given the state of Stochastics oscillators, expect a test (R3), where it is recommended to consider the activity of the parties in the charts of smaller timeframes.

EURUSD intraday forecast (technical side) 2018-05-31

Settlement levels today:
resistance (R1 / R2 / R3 = 1.16789 / 1.17160 / 760);
Support (S1 / S2 / S3 = 1.15589 / 218 / 1.14618).
Key support levels (1 st from 1.16183 to 1.16153 at the end of the day, 2nd from 1.15639 to 1.15919).
Last week, the OsMa indicator signaled an increase in loopers 'activity on breakdowns (down H1 broken / key levels / down H4 broken and a rise in vendors' activity earlier this day after a break up (up H1 broken) after a down h4 broken breakdown ( R1 broken.
Given the state of the Stochastics oscillators, we expect a test (down D1 / R1 broken), where it is recommended to consider the activity of the parties on the charts of smaller timeframes.

USDCHF intraday forecast (technical side) 2018-05-31

Calculation levels:
resistance (R1 / R2 / R3 = 0.99206 / 340/555);
Support (S1 / S2 / S3 = 0.98775 / 641/325).
The key resistance levels (1 st from 0.99083 to 0.998993 at the end of the day, 2nd from 0.99160 to 0.99160).
The OsMa indicator marked and lowered the activity of the parties.
Given the neutral state of the Stochastics oscillators, we expect a level test (S1 / EMA24 / down H1 broken), which recommends considering the activity of the parties on the charts of smaller timeframes.

середу, 30 травня 2018 р.

USDJPY intraday forecast (technical side) 2015-05-31

Estimated levels per day:
resistance (R1 / R2 / R3 = 108.070 / 109.141 / 405);
Support (S1 / S2 / S3 = 108.451 / 289/025).
Key levels (1 st from 109,692 to 108,782 at the end of the day, 2nd from 108,962 to 108,813).
The OsMa indicator for the past year has been indicative of an increase in the activity of buyers, and at the end of the day - sellers breakdown (up H1). At the opening, the elimination is continued to 1 key levels.
Given the neutral state of the Stochastics Oscillators, expect a test (key levels / down h4), where it is recommended to consider the activity of the parties on the charts of smaller timeframes.

понеділок, 28 травня 2018 р.

USDJPY intraday forecast (technical side) 2018-05-29

Estimated levels per day:
resistance (R1 / R2 / R3 = 109.648 / 769/996);
support (S1 / S2 / S3 = 109,255 / 134 / 108,938).
The key resistance levels (1 st from 109,476 to 109,440 at the end of the day, 2nd from 109,560 to 109,468).
The OsMa indicator at the opening of the day was indicative of a significant increase in sellers' breakdown activity (S1 / down D1 '' broken / S2).
Given the state and oscillators of Stochastics, expect a test (S2 broken / S3), where it is recommended to consider the activity of the parties on the charts of smaller timeframes.

USDJPY weekly forecast (technical side) 2018-05-w5

Estimated levels per week:
resistance (R1W1 / R2W1 / R3W1 = 110.914 / 111.490 / 112,422);
support (S1W1 / S2W1 / S3W1 = 109,049 / 108.473 / 107.540).
The key resistance levels (1 st from 110.264 to 109.737 at the end of the week, 2nd from 110.851 to 110.165).
Last week's trading week, the OsMa indicator marked a significant increase in sellers' breakdowns (up D1 broken / key levels).
Given the neutral state of Stochastics oscillators, expect a level test (S1W1 / down H4), where it is recommended to consider the activities of the parties in the charts of smaller timeframes.

USDCHF weekly forecast (technical side) 2018-05-w5

Estimated levels per week:
resistance (R1 / R2 / R3 = 0.99796 / 640/198);
Support (S1 / S2 / S3 = 0.98912 / 330 / 0.98981).
The key resistance levels (1 st from 0.99843 to 0.99271 at the end of the week, 2nd from 0.99959 to 0.99585).
The OsMa indicator highlighted the growth and OB activity of buyers.
Given the orientation of the Stochastics Oscillators, expect a level test (key resistance levels), where it is recommended to consider the activities of the parties in the charts of smaller timeframes.

GBPUSD weekly forecast (technical side) 2018-05-w5

Estimated levels per week:
resistance (R1W1 / R2W1 / R3W1 = 1.34390 / 856 / 1.35611);
Support (S1W1 / S2W1 / S3W1 = 1.32879 / 413 / 1.31657).
The key resistance levels (1 st from 1.34611 to 1.33544 at the end of the week, 2nd from 1.35536 to 1.34303).
The OsMa indicator hasdimensioned the convergence of salespeople activity.
Given the orientation of the Stochastics Oscillators, expect a test (S1W1 / down D1), where it is recommended to consider the activities of the parties in the charts of smaller timeframes.

EURUSD weekly forecast (technical side) 2018-05-w5

Estimated levels per week:
resistance (R1W1 / R2W1 / R3W1 = 1.17905 / 1.8339 / 1.19041);
Support (S1W1 / S2W1 / S3W1 = 1.16501 / 067 / 1.15365).
The key resistance levels (1 st from 1.17734 to 1.17098 at the end of the week, 2nd from 1.18554 to 1.17460).
The OsMa indicator confirmed the convergence of the bear-side activity.
Given the orientation of the Stochastics oscillators, we expect a level test (S1W1 / S2W1 / down H4), where it is recommended to consider the activity of the parties on the charts of smaller timeframes.

неділю, 27 травня 2018 р.

USDJPY weekly results (technical side) 2018-05-w4

The last week started with the mark (Open 110.858; gap +98) with breakdown attempt (R1W1) to (High 111.386); Further downgrades to the key levels and (S1W1) were suspended by the test (S2W1) to (low 108.945) and the correction rate with closure of the week (Close 109.468).

GBPUSD weekly results (technikal side) 2018-05-w4

The last week started with the mark (Open 1.34741; gap +30) with further breakdowns below (S1W1) to (S1W2), correction to (High 1.34903) and gradual breakdown (S2W1 / S3W1), to (Low 1.32926) with closure of the week (Close 1.32966).

USDCHF weekly analysis (technical side) 2019-05-w4

The last week started with the mark (Open = Low 0.99746; gap +1) with the test of key resistance levels up to (High 1.00004) with subsequent breakdown (S1W1 / S2W1) to (S3W1), correction above (S1W1) and repeat breakdowns to (Low 0.98848) . Then there was another correction to (S2W1) and decrease with closing of the week (Close 0.99018).

EURUSD weekly results (technical side) 2018-05-w4

Last week the pair started with the mark (Open 1.17703; gap +5) with the test S1W1 before (17176) and the height up (High 1.18288). Further downgrades formed a down trend (down H4), which became a precondition for further developments. Further, the course breaks the calculated levels of pwttrmya: 1-degree - breakdown S1W1 to S2W1; 2-step - Correction return movement to S1W1 and breakdown below S2W1 to (Low 1.16540) and close the week (Close 1.16600).

четвер, 24 травня 2018 р.

GBPUSD intraday forecast (technical side) 2018-05-25

Estimates for today:
resistance (R1 / R2 / R3 = 1.34111 / 279/553);
Support (S1 / S2 / S3 = 1,33546 / 395/121).
Key levels (1 st from 1. 33569 to 1. 33727 at the end of the day, 2nd from 1.33974 to 1.33834).
The OsMa indicator marked in the first half of the last day the increase in the activity of the locksmiths and the OB factor at the entry of the course at the boundary of the key levels of the cloud, and then the corresponding increase in the activity of sellers at the end of the day.
Given the orientation of the Stochastics Oscillators, we expect a test (1-key levels / S1), where it is recommended to consider the activity of the parties on the charts of smaller timeframes.

EURUSD intraday forecast (technical side) 2018-05-25

Settlement levels today:
resistance (R1 / R2 / R3 = 1.17429 / 570/787);
Support (S1 / S2 / S3 = 1.16975 / 834/607).
The key resistance levels (1 st from 1.17722 to 1.17143 at the end of the day, 2nd from 1.17861 to 1.17519).
The OsMa indicator of the past day highlighted the OB activity factor for looters and the corresponding increase in vendor activity at the beginning of this day.
Given the orientation of the Stochastics oscillators, expect a test (S1), where it is recommended to consider the activity of the parties in the charts of smaller timeframes.

USDCHF intraday forecast (technical side) 2018-05-25

Calculation levels:
resistance (R1 / R2 / R3 = 0.99377 / 522/756);
Support (S1 / S2 / S3 = 0.98910 / 765/532).
The key resistance levels (1 st from 0.99413 to 0.99126 at the end of the day, 2nd from 0.99432 to 0.99309).
The OsMa indicator also highlighted the growth in vendors' activity.
Given the state of the Stochastics oscillators, expect a level test (key resistance levels / R1), where it is recommended to consider the activities of the parties in the charts of smaller timeframes.

USDJPY intraday forecast (technical side) 2018-05-25

Estimated levels per day:
resistance (R1 / R2 / R3 = 109.766 / 998 / 110.372);
support (S1 / S2 / S3 = 109,018 / 108,786 / 412).
The key resistance levels (1 st from 110.166 to 109.330 at the end of the day, 2nd from 110.362 to 109.970).
The OsMa indicator has confirmed the convergence of sellers' activity and the corresponding increase in downstream H1 broken activity.
Given the state of the OB oscillators Stochastics, expect a test (R1), where it is recommended to consider the activity of the parties in the charts of smaller timeframes.

середу, 23 травня 2018 р.

GBPUSD intraday forecast (technical side) 2018-05-24

Estimates for today:
resistance (R1 / R2 / R3 = 1.34237 / 559 / 1.35082);
Support (S1 / S2 / S3 = 1.33192 / 1.32870 / 348).
The key resistance levels (1 st from 1. 34401 to 1. 33569 at the end of the day, 2nd from 1.34412 to 1.33974).
The OsMa indicator was marked in the first half of last day by the increase in vendors' activity and the OS factor, and then the growth of locomotor activity at the end of the day is correspondingly corresponding.
Given the orientation of the Stochastics Oscillators, we expect a test (down H1), where it is recommended to consider the activity of the parties on the charts of smaller timeframes.

EURUSD intraday forecast (technical side) 2018-05-24

Settlement levels today:
resistance (R1 / R2 / R3 = 1.17667 / 933 / 1.18363);
Support (S1 / S2 / S3 = 1.16807 / 541/111).
The key resistance levels (1 st from 1.17722 to 1.17143 at the end of the day, 2nd from 1.17861 to 1.17519).
The OsMa indicator in the first half of the past day marked the OS of the activity of the sellers and the corresponding increase in the activity of locksmiths at the end of the day.
Given the orientation of the Stochastics Oscillators, we expect a test (down H1), where it is recommended to consider the activity of the parties on the charts of smaller timeframes.

USDCHF intraday forecast (technical side) 2018-05-24

Calculation levels:
resistance (R1 / R2 / R3 = 0.99695 / 892 / 1.00212);
Support (S1 / S2 / S3 = 0.99055 / 0.98858 / 538).
The key resistance levels (1 st from 0.99425 to 0.99413 at the end of the day, 2nd from 0.99586 to 0.99432).
The OsMa indicator marked the convergence of sellers and increased customer activity.
Given the orientation of the Stochastics Oscillators, expect a level test (key resistance levels), where it is recommended to consider the activities of the parties in the charts of smaller timeframes.

USDJPY intraday forecast (technical side) 2018-05-24

Estimated levels per day:
resistance (R1 / R2 / R3 = 110.604 / 916 / 111.420);
Support (S1 / S2 / S3 = 109,595 / 283 / 108,778).
The key resistance levels (1 st from 10,945 to 110,166 at the end of the day, 2nd from 111,020 to 110,362).
The OsMa indicator highlighted the growth in sellers' activity in the first half of the past day by the breakdown (up D1 broken) and buyers in the afternoon.
Given the state of OS oscillators Stochastics, expect a test (S1), where it is recommended to consider the activity of the parties on the charts of smaller timeframes.

понеділок, 21 травня 2018 р.

GBPUSD intraday forecast (technical side) 2018-05-22

Estimates for today:
resistance (R1 / R2 / R3 = 1.34637 / 837 / 1.35859);
Support (S1 / S2 / S3 = 1.33993 / 793/471).
The key resistance levels (1 st from 1.35491 to 1. 35756 at the end of the day, 2nd from 1.35380 to 1.35541).
The OsMa indicator is the ultimate convergence of sellers' activity when testing the levels (S2W1 / down D1 broken) and increasing the acuity of buyers at the end of the day.
 Given the orientation of the Stochastics Oscillators, expect a Level Test (S2W1 tested), where it is recommended to consider the activities of the parties on the charts of smaller timeframes.

EURUSD intraday forecast (technical side) 2018-05-22

Settlement levels today:
resistance (R1 / R2 / R3 = 1.17979 / 1.18170 / 478);
support (S1 / S2 / S3 = 1.17362 / 171 / 1.16862).
Key levels (1 st from 1.17768 to 1.17623 at the end of the day, 2nd from 1.17928 to 1.17684).
The OsMa indicator in the first half of the past day marked the convergence of sellers' activity and the corresponding increase in activity of loopers (down H4 broken) and when entering the rate at the limit of the key levels cloud at the end of the day.
Given the orientation of the Stochastics Oscillators, expect a key level test, where it is recommended to consider the activity of the parties on the charts of smaller timeframes.

USDCHF intraday forecast (technical side) 2018-05-22

Calculation levels:
resistance (R1 / R2 / R3 = 0.99909 / 995 / 1.00134);
Support (S1 / S2 / S3 = 0.99631 / 545/406).
The key resistance levels (1 st from 0.99797 to 0.99779 at the end of the day, 2nd from 0.99907 to 0.99828).
The OsMa indicator marked the fluctuation of the string activity.
Given the state of the OB oscillators of Stochastics, we expect a level test (S1 / down H1), where it is recommended to consider the activities of the parties on the charts of smaller timeframes.

USDJPY intraday forecast (technical side) 2018-05-22

Estimated levels per day:
 resistance (R1 / R2 / R3 = 111.274 / 390/579);
Support (S1 / S2 / S3 = 110,896 / 780/591).
Key support levels (1 st from 110.803 to 111.096 at the end of the day, 2nd from 110.570 to 110.993).
The OsMa indicator highlighted the growth of buyer activity in the first half of last day and sellers in the afternoon.
Given the state of OS oscillators Stochastics, expect a test (S1 / up H4 broken / key support levels), where it is recommended to consider the activities of the parties in the charts of smaller timeframes.

GBPUSD weekly forecast (technical side) 2018-05-w4

Estimated levels per week:
resistance (R1W1 / R2W1 / R3W1 = 1.35712 / 1.36083 / 682);
Support (S1W1 / S2W1 / S3W1 = 1.34513 / 142 / 1.33542).
The key resistance levels (1 st from 1.35380 to 1.35063 at the end of the week, 2nd from 1.35536 to 1.35336).
The OsMa indicator hasdimited the growth of vendors' activity when testing key levels of resistance.
Given the state of OS oscillators Stochastics, expect a test (S1W1 / down D1 broken / S2W1), where it is recommended to consider the activity of the parties in the charts of smaller timeframes.

неділю, 20 травня 2018 р.

EURUSD weekly forecast (technical side) 2018-05-w4

Estimated levels per week:
resistance (R1W1 / R2W1 / R3W1 = 1.19305 / 886 / 1.20826);
Support (S1W1 / S2W1 / S3W1 = 1.17424 / 1.16843 / 1.15902).
The key resistance levels (1 st from 1.19085 to 1.18110 at the end of the week, 2nd from 1.19410 to 1.18690).
The OsMa indicator marked the growth of the bear-side activity.
Given the state of OS oscillators Stochastics, expect a level test (S1W1 / down H4 / down D1 broken), where it is recommended to consider the activities of the parties in the charts of smaller timeframes.

USDCHF weekly forecast (technical side) 2018-05-w4

Estimated levels per week:
resistance (R1 / R2 / R3 = 1.00244 / 460/809);
Support (S1 / S2 / S3 = 0.99546 / 330 / 0.98981).
The key resistance levels (1 st from 0.99954 to 1.00025 at the end of the week, 2nd from 1.00062 to 0.99925).
The OsMa indicator marked a decline in buyer activity and a rise in vendors' activity during the week.
Given the orientation of the Stochastics Oscillators, expect a level test (key resistance levels), where it is recommended to consider the activities of the parties in the charts of smaller timeframes.

USDJPY weekly forecast (technical side) 2018-05-w4

Estimated levels per week:
resistance (R1W1 / R2W1 / R3W1 = 111.097 / 539 / 112.55);
Support (S1W1 / S2W1 / S3W1 = 109.655 / 223 / 109.507).
Key support levels (1 st from 109,489 to 110,624 at the end of the week, 2nd from 109.324 to 110.132).
Last weekend, the OsMa indicator confirmed divergence of buyers. The activity of bulls at breakdown (up D1 broken / R2MN broken) at the end of the week decreased.
Given the state and orientation of the Stochastics oscillators, expect a level test (R1W1 / up H4), where it is recommended to consider the activity of the parties in the charts of smaller timeframes.

понеділок, 14 травня 2018 р.

GBPUSD intraday forecast (technical side) 2018-05-15

Estimates for today:
resistance (R1 / R2 / R3 = 1.35949 / 1.36103 / 353);
Support (S1 / S2 / S3 = 1.35443 / 295/045).
Key support levels (1 st from 1.35491 to 1. 35756 at the end of the day, 2nd from 1.35380 to 1.35541).
The OsMa indicator is a whimsical divergence of the poeivac activity (sidewalk) when testing the levels (R1W1) and increasing the acuity of vendors at break (up H1 broken).
 Given the state and direction of the Stochastics Oscillators, expect a level test (key support levels / S1 / S2MN), where it is recommended to consider the activities of the parties in the charts of smaller timeframes.

EURUSD intraday forecast (technical side) 2018-05-15

Settlement levels today:
resistance (R1 / R2 / R3 = 1.19759 / 939 / 1.20215);
Support (S1 / S2 / S3 = 1.19218 / 048 / 1.18773).
Key levels (1 st from 1.19392 to 1.19685 at the end of the day, 2nd from 1.19047 to 1.19427).
Indicator OsMa in the first half of the day confirmed divergence active customers (bychoyi side) at testing level (R1W1) and noted increased activity appropriate vendors (bear side) and lowering the door of course within the boundaries of cloud key levels at the end of the day.
Given the orientation of oscillators Stochastics, expect a test levels (up H4 / 1 key level / S1), where it is recommended to consider the activity of the parties on the charts of smaller timeframes.

USDCHF intraday forecast (technical side) 2018-05-15

Calculation levels:
resistance (R1 / R2 / R3 = 1.00106 / 234/441);
Support (S1 / S2 / S3 = 0.99691 / 563/355).
The key resistance levels (1 st from 1.00005 to 0.99848 at the end of the day, 2nd from 1.00156 to 0.99977).
The OsMa indicator marked the convergence of bear activity and the growth of the sidewalk activity.
Given the state of the OB oscillators in Stochastics, expect a level test (1-key resistance levels / R1 / up broken / down H1), where it is recommended to consider the activities of the parties in the charts of smaller timeframes.

USDJPY intraday forecast (technical side) 2018-05-15

Estimated levels per day:
 resistance (R1 / R2 / R3 = 109.759 / 886/970);
Support (S1 / S2 / S3 = 109,347 / 220/014).
Key support levels (1 st from 109,576 to 109,506 at the end of the day, 2nd from 109,318 to 108,424).
The OsMa indicator marked the divergence of buyers' activity at breakdowns of key levels.
Given the state of the OB oscillators of Stochastics, expect a test (R1 / R1W1), where it is recommended to consider the activity of the parties in the charts of smaller timeframes.

неділю, 13 травня 2018 р.

USDJPY weekly forecast (technical side) 2018-05-w3

Estimated levels per week:
resistance (R1W1 / R2W1 / R3W1 = 109.716 / 970 / 110.380);
Support (S1W1 / S2W1 / S3W1 = 108,895 / 641/230).
Key levels (1 st from 109.332 to 109.452 at the end of the week, 2nd from 109.263 to 109.324).
The OsMa indicator confirmed the buyer divergence in the first half past of the last trading week and the uptime D1 broken at the end of the week.
Given the orientation of the Stochastics oscillators, we expect a level test (up D1 broken / R1W1 / key levels), where it is recommended to consider the activities of the parties on the charts of smaller timeframes.

USDCHF weekly forecast (technical side) 2018-05-w3

Estimated levels per week:
resistance (R1 / R2 / R3 = 1.00276 / 403/591);
Support (S1 / S2 / S3 = 0.99794 / 606/301).
Key levels (1 st from 0.99629 to 1.00109 at the end of the week, 2nd from 1.00159 to 1.00114).
The OsMa indicator has confirmed the divergence of buyer activity in the first half of last week and the increase in sellers' activity during the week.
Given the orientation of the Stochastics oscillators, expect a test level (S1W1), where it is recommended to consider the activity of the parties in the charts of smaller timeframes.

EURUSD weekly forecast (technical side) 2018-05-w3

Estimated levels per week:
resistance (R1W1 / R2W1 / R3W1 = 1.19758 / 1.20125 / 718);
Support (S1W1 / S2W1 / S3W1 = 1.18752 / 205 / 1.17612).
Key levels (1 st from 1.19799 to 1.19165 at the end of the week, 2nd from 1.18748 to 1.19125).
The OsMa indicator confirmed the convergence of the bearish activity at the beginning of last week and the growth of the activity of the bulls at breakdown (down D1broken), which provides the basis for planning trade corrections.
Given the status and intermittence of Stochastics oscillators, we expect a level test (R1W1 / S2MN broken / 1-Key levels), where it is recommended to consider the activity of the parties in the charts of smaller timeframes.

GBPUSD weekly forecast (technical side) 2018-05-w3

Estimated levels per week:
resistance (R1W1 / R2W1 / R3W1 = 1.35944 / 1.36291 / 853);
Support (S1W1 / S2W1 / S3W1 = 1.34820 / 473 / 1.33911).
Key levels (1 st from 1.35468 to 1.35380 at the end of the week, 2nd from 1.37080 to 1.35429).
The OsMa indicator has confirmed the convergence of salespeople activity, which provides a basis for planning trade corrections.
Given the state of the Stochastics oscillators, expect a test (R1W1 / S2MN tested), where it is recommended to consider the activity of the parties on the charts of smaller timeframes.

четвер, 3 травня 2018 р.

GBPUSD intraday forecast (technical side) 2018-05-04

Estimates for today:
resistance (R1 / R2 / R3 = 1.36135 / 350/699);
 Support (S1 / S2 / S3 = 1.35238 / 223 / 1.34875).
The key resistance levels (1 st from 1. 36062 to 1. 36062 at the end of the day, 2nd from 1.36630 to 1.36630).
The OsMa indicator has confirmed the convergence of sellers' activity (bear-side) when testing levels (S3W1 / S2MN) and down (H1 broken).
 Given the orientation of the Stochastics oscillators, expect a level test (key resistance levels / S3W1), where it is recommended to consider the activity of the parties in the charts of smaller timeframes.

EURUSD intraday forecast (technical side) 2018-05-04

Settlement levels today:
resistance (R1 / R2 / R3 = 1,20042 / 185/417);
Support (S1 / S2 / S3 = 1.19578 / 435/203).
Key levels (1 st from 1.19824 to 1.19824 at the end of the day, 2nd from 1.20102 to 1.20102).
Indicator OsMa marked increase in activity of buyers (bychoyi side) in the first half of the day and reduce it at the door of course within the boundaries of cloud key levels at the end of the day.
Given the orientation of oscillators Stochastics, expect a test levels (key resistance levels / down H4), where it is recommended to consider the activity of the parties on the charts of smaller timeframes.

USDCHF intraday forecast (technical side) 2018-05-04

Calculation levels:
resistance (R1 / R2 / R3 = 0.99919 / 1.00020 / 186);
Support (S1 / S2 / S3 = 0.99585 / 483/316).
Key support levels (1 st from 0.99682 to 0.99794 at the end of the day, 2nd from 0.99493 to 0.99671).
The OsMa indicator marked the growth of bearish activity and confirmed the divergence of the party's activity.
Given the state of the state of the Stochastics oscillators, we expect a level test (up H4 broken / key support levels), where it is recommended to consider the activity of the parties on the charts of smaller timeframes.

USDJPY intraday forecast (technical side) 2018-05-04

Estimated levels per day:
 resistance (R1 / R2 / R3 = 109.639 / 858.088 / 110.210);
Support (S1 / S2 / S3 = 109,932 / 713/360).
The key resistance levels (1 st from 108,628 to 109,266 at the end of the day, 2nd from 109,806 to 108,473).
The OsMa indicator marked the growth of the bear-side activity on the breakdown (key levels).
Given the state of the state of the Stochastics oscillators, expect a test (S1), where it is recommended to consider the activity of the parties on the charts of smaller timeframes.

USDJPY intraday forecast (technical side) 2018-05-03

Estimated levels per day:
 resistance (R1 / R2 / R3 = 109.984 / 110.088 / 256),
support (S1 / S2 / S3 = 109,648 / 544/376).
Key levels (1 st from 109,639 to 109,806 at the end of the day, 2nd from 109,445 to 108,628).
The OsMa indicator marked the divergence and the growth of the bearish activity on the break (up H4 broken / 1 key levels).
Given the orientation of the Stochastics Oscillators, we expect a test (up H4 broken / R1MN tested / S1), where it is recommended to consider the activity of the parties in the charts of smaller timeframes.

USDCHF intraday forecast (technical side) 2018-05-03

Calculation levels:
resistance (R1 / R2 / R3 = 0.99997 / 1.00147 / 390);
Support (S1 / S2 / S3 = 0.99511 / 361/118).
Key support levels (1 st from 0.99447 to 0.99682 at the end of the day, 2nd from 0.99202 to 0.99493).
The OsMa indicator confirmed the divergence of buyer activity (sideways).
Given the neutral state of Stochastics oscillators, expect a test level (up H4 / Key Support levels), where it is recommended to consider the activity of the parties on the charts of smaller timeframes.

EURUSD intraday forecast (technical side) 2018-05-03

Settlement levels today:
resistance (R1 / R2 / R3 = 1,20082 / 303/661);
Support (S1 / S2 / S3 = 1.19366 / 145 / 1.18787).
The key resistance levels (1 st from 1.20161 to 1.19824 at the end of the day, 2nd from 1.20583 to 1.20102).
The OsMa indicator has confirmed the convergence of sellers' activity (bear-side) during testing (S2 MN tested).
Given the orientation of the Stochastics Oscillators, expect a level test (key resistance levels / down H4 / R1 / R2), where it is recommended to consider the activities of the parties in the charts of smaller timeframes.

середу, 2 травня 2018 р.

GBPUSD intraday forecast (technical side) 2018-05-03

Estimates for today:
resistance (R1 / R2 / R3 = 1.36395 / 656 / 1.37079);
 Support (S1 / S2 / S3 = 1.35548 / 287 / 1.34863).
The key resistance levels (1 st from 1. 36474 to 1. 36062 at the end of the day, 2nd from 1.36893 to 1.36630).
The OsMa indicator marked a decrease in the bear-side activity when testing levels (S3W1).
 Given the orientation of the Stochastics oscillators, expect a level test (down H10, where it is recommended to consider the activity of the parties in the charts of smaller timeframes.

вівторок, 1 травня 2018 р.

GBPUSD monthly forecast (technical side) 2018-05

Estimated levels per month:
 resistance (R1MN / R2MN / R3MN = 1.42063 / 1.43629 / 1.46165);
 support (S1MN / S2MN / S3MN = 1.36991 / 1.35425 / 1.32889).
The key resistance levels (1 st from 1,39940 to 1,40431 at the end of the month, 2nd from 1,40628 to 1,41347).
The OsMa indicator marked the growth of bears' activity at breakdowns of key levels and (up D1 broken/ up W1 broken/ S1 MN broken), but also formed a long-term divergence that provides a basis for planning trade correction .
Given the state of OS oscillators Stochastics, expect a test level (S2 MN / S1 MN broken), where it is recommended to consider the activity of the parties in the charts of smaller timeframes.