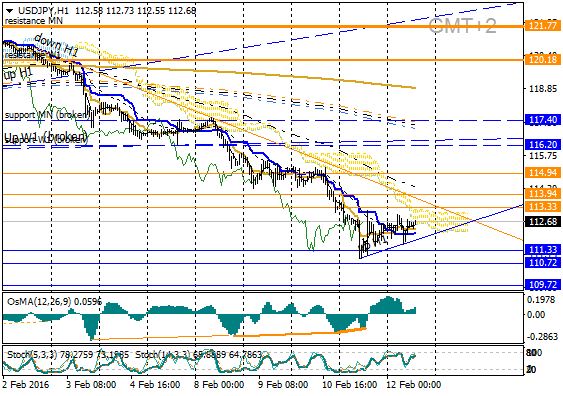
Calculated level for today:
Support (S1 / S2 / S3 = 111,33 / 110,72 / 109,72), resistance (R1 / R2 / R3 = 113,33 / 94 / 114.94).
Key resistance levels (1st from 114.17 to 112.34 at the end of the day, the 2nd of 114.48 to 113.12).
Over the past day trading depreciation was confirmed.
Indicator OsMa marked decrease in activity bearish side, which is the basis for planning of trading correction.
More details https://www.mql5.com/ru/users/bi0l/blog


