weekly forecast (technical side)

GBPUSD weekly forecast (technical side) 2018-06-(11-15)

четвер, 15 березня 2018 р.

GBPUSD intraday forecast (technical side) 2018-03-16


Estimates for today:
resistance (R1 / R2 / R3 = 1.39737 / 894 / 1.40150);
 Support (S1 / S2 / S3 = 1.39225 / 068 / 1.38812).
Key levels (1 st from 1.39342 to 1.39548 at the end of the day, 2nd from 1.39551 to 1.39577).
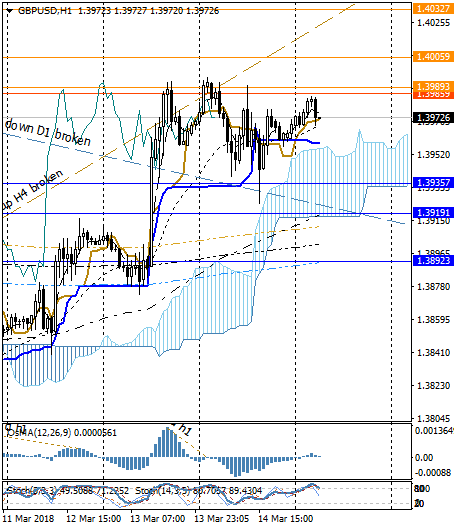
The OsMa indicator showed an increase in the activity of the Hedgehog breakdown (up H4 broken).
 Given the orientation of the Stochastics Oscillators, we expect a key level test (EMA24 / EMA120), where it is recommended to consider the activities of the parties on the charts of smaller timeframes.

EURUSD intraday forecast (technical side) 2018-03-16


Settlement levels today:
  (R1 / R2 / R3 = 1.23611 / 807 / 1.24125),
Support (S1 / S2 / S3 = 1.22974 / 778/459).
The key resistance levels (1 st from 1.23627 to 1.23322 at the end of the day, 2nd from 1.23705 to 1.23556).
The OsMa indicator marked the growth of bears' activity at breakdown levels (up H4 broken), but also noticed convergence.
Given the orientation of the Stochastics oscillators, we expect a test of the levels (EMA24 / EMA522 / EMA120), where it is recommended to consider the activity of the parties in the charts of smaller timeframes.

USDCHF intraday forecast (technical side) 2018-03-16


Calculation levels:
resistance (R1 / R2 / R3 = 0.95208 / 410/742);
Support (S1 / S2 / S3 = 0.94548 / 344/014).
Key support levels (1 st from 0.94581 to 0.9454 end of day, 2nd to 0.94554 0.94712).
The OsMa indicator marked an increase in the activity of the bouncing side of the key level breakdown and (down H1 broken).
Given the Stochastics oscillator guidance, expect a test level (EMA24 / EMA1560 / R1), where it is recommended to consider the party's activity on the charts of smaller timeframes.

USDJPY intraday forecast (technical side) 2018-03-16


Calculation levels:
 resistance (R1 / R2 / R3 = 106.401 / 549/789),
support support (S1 / S2 / S3 = 105,920 / 772/531).
The key resistance levels (1 st from 106,570 to 106,257 at the end of the day, 2nd from 106,570 to 106,111).
The OsMa indicator marked an increase in the party's side activity during the testing of key levels of resistance at the end of the day and the growth of bear activity early in the day.
Given the state of the Stochastics oscillators, expect a test (up D1, S1, S2), where it is recommended to consider the activity of the parties in the charts of smaller timeframes.

GBPUSD intraday forecast (technical side) 2018-03-15


Estimates for today:
resistance (R1 / R2 / R3 = 1.39893 / 1.40059 / 327);
 Support (S1 / S2 / S3 = 1.39357 / 191 / 1u38923).
The key resistance levels (1 st from 1.39496 to 1.39551 at the end of the day, 2nd from 1.39165 to 1.39342).
The OsMa indicator marked the growth of the bear-side activity during testing (down D1 broken).
 Given the conglomeration of the Stochastics oscillators, expect a level test (R1 / EMA24), where it is recommended to consider the activity of the parties on the charts of smaller timeframes.

EURUSD intraday forecast (technical side) 2018-03-15


Settlement levels today:
 resistance (R1 / R2 / R3 = 1.24023 / 177/427),
Support (S1 / S2 / S3 = 1.23524 / 370/121).
Key levels (1 st from 1.23664 to 1.23705 at the end of the day, 2nd from 1.23480 to 1.2.26367).
The OsMa indicator marked the growth of bears' activity in testing key levels.
Given the state and orientation of Stochastics oscillators, expect a key level test, where it is recommended to consider the activity of the parties on the charts of smaller timeframes.

середу, 14 березня 2018 р.

USDCHF intraday forecast (technical side) 2018-03-15


Calculation levels:
resistance (R1 / R2 / R3 = 0.94700 / 832 / 0.95045);
support (S1 / S2 / S3 = 0.94273 / 141 / 0.93927).
The key resistance levels (1 st from 0.94548 to 0.94559 at the end of the day, 2nd from 0.94712 to 0.94581).
The OsMa indicator marked an increase in the activity of the bite side when testing key levels.
Given the state and direction of Stochastics oscillators, we expect to continue the key level test and (up H4) test, where it is recommended to consider the activities of the parties on the charts of smaller timeframes.

USDJPY intraday forecast (technical side) 2018-03-15


Calculation levels:
 resistance (R1 / R2 / R3 = 106.577 / 738/998),
support support (S1 / S2 / S3 = 106,056 / 105.895 / 105.634).
The key resistance levels (1 st from 106.764 to 106.570 at the end of the day, 2nd from 106.757 to 106.539).
The OsMa indicator highlighted the growth momentum and convergence of the bear-side activity.
Given the directional Stochastics oscillators, expect a test (up D1, S1, S2), where it is recommended to consider the activity of the parties on the charts of smaller timeframes.

вівторок, 13 березня 2018 р.

GBPUSD intraday forecast (technical side) 201-03-14

GBPUSD H1
Estimates for today:
resistance (R1 / R2 / R3 = 1.39912 / 1.40193 / 648);
 Support (S1 / S2 / S3 = 1.39001 / 1.38720 / 263).
The key resistance levels (1 st from 1.38881 to 1.39469 at the end of the day, 2nd from 1.38484 to 1.39165).
The OsMa indicator marked a significant increase in the activity of the side whipping on a breakdown (down D1).
 Given the conglomeration of Stochastics oscillators, we expect a level test (R1 / EMA24 / down D1 broken), where it is recommended to consider the activity of the parties on the charts of smaller timeframes.

EURUSD intraday forecast (technical side) 2018-03-14

EURUSD H1
Settlement levels today:
 resistance (R1 / R2 / R3 = 1,24061 / 280/634),
Support (S1 / S2 / S3 = 1.23353 / 134 / 1.22780).
Key support levels (1 st from 1.23213 to 1.23664 at the end of the day, 2nd from 1.23084 to 1.23480).
The OsMa indicator marked a significant increase in the activity of bulls at the breakdown of key levels.
Given the state of OB and the orientation of the Stochastics oscillators, we expect a level test (R1 / down D1), where it is recommended to consider the activities of the parties in the charts of smaller timeframes.

USDCHF intraday forecast (technical side) 2018-03-14

USDCHF H1
Calculation levels:
resistance (R1 / R2 / R3 = 0.94679 / 921 / 0.95168);
Support (S1 / S2 / S3 = 0.94276 / 124 / 0.93878).
The key resistance levels (1 st from 0.94821 to 0.94548 at the end of the day, 2nd from 0.94959 to 0.94712).
The OsMa indicator marked the decline in the bear-side activity and convergence.
Given the state and direction of the Stochastics oscillators, expect a level test (S1 / up H4), where it is recommended to consider the activity of the parties on the charts of smaller timeframes.

USDJPY intraday forecast (technical side) 2018-03-14


Calculation levels:
resistance (R1 / R2 / R3 = 107.080 / 325/722),
Support (S1 / S2 / S3 = 106,286 / 041 / 105,644).
Key levels (1 st from 106,570 to 106,764 at the end of the day, 2nd from 106,539 to 106,757).
The OsMa indicator marked an increase in activity in opposition between the parties.
Given Stochastics oscillators, expect a test (up H4) and key levels, where it is recommended to consider the activity of the parties on the charts of smaller timeframes.

четвер, 8 березня 2018 р.

GBPUSD intraday forecast (technical side) 2018-03-09


Estimates for today:
resistance (R1 / R2 / R3 = 1.38797 / 1.39101 / 591),
 Support (S1 / S2 / S3 = 1.37817 / 513/023).
The key resistance levels (1 st from 1.38721 to 1.38393 at the end of the day, 2nd from 1.38819 to 1.38458).
The OsMa indicator marked the growth of the bearish activity, a breakdown (up H4 broken) and key levels.
 Given the state of the Stochastics oscillators, expect a test level (S1 / EMA24), where it is recommended to consider the activity of the parties in the charts of smaller timeframes.

EURUSD intraday forecast (technical side) 2018-03-09


Settlement levels today:
 resistance (R1 / R2 / R3 = 1.24060 / 409/975),
Support (S1 / S2 / S3 = 1.22929 / 580/015).
The key resistance levels (1 st from 1.23833 to 1.23609 at the end of the day, 2nd from 1.24086 to 1.23712).
The OsMa indicator marked a significant increase in the activity of bears at the breakdown of key levels, which provides a basis for planning sales transactions with a sales advantage ..
Given the orientation of the Stochastics Oscillators, we expect a test of the levels (EMA522 / EMA24 / S1 / down H4 broken), where it is recommended to consider the activities of the parties on the charts of smaller timeframes.

USDCHF intraday forecast (technical side) 2018-03-09


Calculation levels:
resistance (R1 / R2 / R3 = 0.95222 / 454/829);
Support (S1 / S2 / S3 = 0.94471 / 239 / 0.93863).
Key support levels (1 st from 0.94110 to 0.94792 at the end of the day, 2nd from 0.93989 to 0.94378).
The OsMa indicator marked the growth of the side-to-break activity (down D1 broken / R1W1broken / R1MN broken), but also divergence.
Given the direction of the Stochastics Oscillators, expect a test level (EMA1560 / R1), where it is recommended to consider the activity of the parties in the charts of smaller timeframes.

USDJPY intraday forecast (technical side) 2018-03-09


Calculation levels:
resistance (R1 / R2 / R3 = 106.451 / 580/789),
Support (S1 / S2 / S3 = 106,033 / 105.904 / 695).
Key support levels (1 st from 105.951 to 106.132 at the end of the day, 2nd from 105.913 to 105.877).
The OsMa indicator marked a sharp increase in the activity of the side whipping down (down H1 boken), and the diveogkntsiyu.
Given the state of the OB oscillators of Stochastics, we expect a test (down D1), where it is recommended to consider the activity of the parties on the charts of smaller timeframes.

GBPUSD intraday forecast (technical side) 2018-03-08


Estimates for today:
 resistance (R1 / R2 / R3 = 1.39117 / 273/524),
 support (S1 / S2 / S3 = 1,38615 / 459/208).
Key support levels (1 st from 1.38825 to 1.38819 at the end of the day, 2nd from 1.38471 to 1.38721).
The OsMa indicator signaled a decrease in the activity of bulls and an increase in bearish aetiology, although a breakdown (down H4 broken).
 Given the orientation of the Stochastics oscillators, we expect a level test (R1 / EMA522 / R2 / EMA522 / down H4 broken / key support levels), where it is recommended to consider the activity of the parties on the charts of smaller timeframes.

середу, 7 березня 2018 р.

EURUSD intraday forecast (technical side) 2018-03-08


Settlement levels today:
 resistance (R1 / R2 / R3 = 1.24284 / 522/906),
Support (S1 / S2 / S3 = 1.23516 / 278 / 1.22894).
Key support levels (1 st from 1.23922 to .24086 at the end of the day, 2nd from 1.23481 to 1.23833).
The OsMa indicator marked the growth of bears' activity on breakdown (upH1 broken), which provides the basis for planning trading operations for correction with the advantage of sales.
Given the orientation of the Stochastics Oscillators, we expect a level test (R1 / up D1 broken / R2 / R1MN) and key levels of support, where it is recommended to consider the activity of the parties in the charts of smaller timeframes.

USDCHF intraday forecast (technical side) 2018-03-08


Calculation levels:
resistance (R1 / R2 / R3 = 0.94431 / 632/958);
Support (S1 / S2 / S3 = 0.93779 / 578/252).
The key support levels (1 st from 0.93871 to 0.9410 at the end of the day, 2nd from 0.93816 to 0.93989).
The OsMa indicator marked an increase in the party's activity on the breakdown of key levels and (down H4).
Given the state of the Stochastics oscillators, we expect a test level (EMA24 / down D1 / S1), where it is recommended to consider the activity of the parties in the charts of smaller timeframes.

USDJPY intraday forecast (technical side) 2018-03-08


Calculation levels:
resistance (R1 / R2 / R3 = 106.233 / 402/675),
support (S1 / S2 / S3 = 105,688 / 519/247).
Key support levels (1st of 105,910 to 105,951 at the end of the day, 2nd of 105,898 to 105,913).
The OsMa indicator marked an increase in the activity of the party's strike on the breakdown of key levels.
Taking into account the Stochastics oscillators, we expect a key support level test, where it is recommended to consider the parties' activity on smaller timetable charts.

вівторок, 6 березня 2018 р.

GBPUSD intraday forecast (technical side) 2018-03-07


Estimates for today:
 resistance (R1 / R2 / R3 = 1.39237 / 503/933),
 Support (S1 / S2 / S3 = 1.38377 / 111 / 1.37681).
Key support levels (1 st from 1.38288 to 1.38825 at the end of the day, 2nd from 1.37993 to 1.38471).
The OsMa indicator confirmed the divergence of bull activity and the growth of bear aetiology.
 Given the state of the Stochastics oscillators, we expect a test of the levels (EMA24 / EMA522 / down H4 / upH4), where it is recommended to consider the activities of the parties on the charts of smaller timeframes.

EURUSD intraday forecast (technical side) 2018-03-07


Settlement levels today:
 resistance (R1 / R2 / R3 = 1.24284 / 522/906),
Support (S1 / S2 / S3 = 1.23516 / 278 / 1.22894).
Key support levels (1 st from 1.23203 to .23922 at the end of the day, 2nd from 1.22795 to 1.23481).
The OsMa indicator marked a decrease in the activity of the bulls, which provides the basis for the planning of trade operations correction ..
Given the orientation of the Stochastics oscillators, we expect a level test (R1 / up H1 / down H4 broken), where it is recommended to consider the activity of the parties in the charts of smaller timings.

USDCHF intraday forecast (technical side) 2018-03-07


Calculation levels:
resistance (R1 / R2 / R3 = 0.94065 / 224/449);
Support (S1 / S2 / S3 = 0.93635 / 496/271).
Key levels (1 st from 0.93512 to 0.93816 at the end of the day, 2nd from 0.93652 to 0.93871).
The OsMa indicator marked fluctuations and decreased activity of the parties.
Given the state of the Stochastics oscillators, we expect a test level (up H4 / S1 / key levels), where it is recommended to consider the activities of the parties on the charts of smaller timeframes.

USDJPY intraday forecast (technical side) 2018-03-07


Calculation levels:
resistance (R1 / R2 / R3 = 106.209 / 446/830),
Support (S1 / S2 / S3 = 105,440 / 203 / 104,818).
The key resistance levels (1st of 105.874 to 105.898 at the end of the day, 2nd of 105.862 to 105.910).
The OsMa indicator marked a significant fluctuation in page activity when testing key levels.
Given the neutral state of Stochastics oscillators, expect a level test (S1MN / up H1 / S1 / S2) and key levels, where it is recommended to consider the activities of the parties in the charts of smaller timeframes.

USDCHF intraday forecast (technical side) 2018-03-06


Calculation levels:
resistance (R1 / R2 / R3 = 0.94062 / 191/399);
Support (S1 / S2 / S3 = 0.93646 / 517/309).
Key levels (1 st from 0.94135 to 0.94035 at the end of the day, 2nd from 0.93734 to 0.93834).
The OsMa indicator marked the increase in bull's activity.
Given the state of the Stochastics oscillators, expect a level test (S1 / S2), where it is recommended to consider the activity of the parties on the charts of smaller timeframes.

EURUSD intraday forecast (technical side) 2018-03-06


Settlement levels today:
 resistance (R1 / R2 / R3 = 1.23476 / 664/968),
Support (S1 / S2 / S3 = 1.22868 / 651/378).
Key support levels (1 st from 1.23176 to 1.23203 at the end of the day, 2nd from 1.22589 to 1.22795).
The OsMa indicator marked a decrease in the activity of the bulls, which provides the basis for the planning of trade operations correction ..
Given the orientation of the Stochastics Oscillators, we expect a level test (R1 / up H1 / down H4 broken / EMA24 / R1W1), where it is recommended to consider the activity of the parties in the charts of smaller timeframes.

понеділок, 5 березня 2018 р.

GBPUSD intraday forecast (technical side) 2018-03-06


Estimates for today:
 resistance (R1 / R2 / R3 = 1.38721 / 981 / 1.39403),
 Support (S1 / S2 / S3 = 1.37877 / 617/195).
Key support levels (1 st from 1.37848 to 1.38288 at the end of the day, 2nd from 1.37634 to 1.37993).
The OsMa indicator marked a decrease in bull's activity.
 Given the state of the Stochastics oscillators, expect a test of the levels (EMA120 / EMA24 / down H4 / upH4), where it is recommended to consider the activities of the parties in the charts of smaller timeframes.

неділю, 4 березня 2018 р.

GBPUSD D1 monthly forecast (technical side) 2018-03


Estimated levels per month:
 resistance (R1 / R2 / R3 = 1.41284 / 1.42532 / 1.44552),
 Support (S1 / S2 / S3 = 1.37243 / 1.35995 / 1.333974).
The key resistance levels (1 st from 1.38155 to 1.38450 at the end of the month, 2nd from 1.40000 to 1.40116).
The OsMa indicator marked a slight decrease in the activity of bears after the breakdown (up D1 broken) at the end of last month, providing a basis for planning trade correction /
Given the orientation of the Stochastics oscillators, we expect a test (up D1 broken) and key resistance levels, which recommends considering the activity of the parties on the charts of smaller timeframes.

EURUSD D1 monthly forecast (technical side) 2018-03


Estimated levels per month:
 resistance (R1 / R2 / R3 = 1.24510 / 1.25377 / 1.26780);
 Support (S1 / S2 / S3 = 1.21705 / 1.20838 / 1.19436).
 Key levels (1 st from 1.21268 to 1.22001 at the end of the month, 2nd from 1.23002 to 1.23931).
 The OsMaI indicator marked a decrease in the activity of the parties, which provides the basis for the planning of trade transactions correction.
Given the orientation of the Stochastics oscillators, we expect a test level (up D1 broken, EMA24, EMA120), where it is recommended to consider the activities of the parties in the charts of smaller timeframes.

USDCHF D1 monthly forecast (technical side) 2018-03


Estimated levels per month:
resistance (R1 / R2 / R3 = 0.94744 / 0.95410 / 0.96490):
Support (S1 / S2 / S3 = 0.92585 / 0.91919 / 0.90840).
The key resistance levels (1 st from 0.95153 to 0.93125 at the end of the month, 2nd from 0.96328 to 0.95505).
For the past month, the OsMa indicator marked a double increase in the activity of bulls. But the month is open at a rate lowered from key levels of resistance.
Given the state and orientation of the Stochastics oscillators, we expect a level test (up H4 / down D1 broken), where it is recommended to consider the activity of the parties in the charts of smaller timeframes.

USDJPY D1 monthly forecast (technical side) 2018-03


Estimated levels per month:
resistance (R1 / R2 / R3 = 109.431 / 110.596 / 112.480);
support (S1 / S2 / S3 = 105,682 / 104,497 / 102,612).
The key resistance levels (1 st from 110.285 to 107.362 at the end of the month, 2nd from 111.004 to 109.459).
The OsMa indicator confirmed convergence and marked an increase in party side activity at the end of last month, which provides a basis for planning trade corrections
Given the state and direction of the Stochastics oscilloscope, expect a level test (S1, S2, down D1, EMA24, EMA1560, up MN broken), where it is recommended to consider the activities of the parties on the charts of smaller timeframes.

четвер, 1 березня 2018 р.

GBPUSD intraday forecast (technical side) 2018-03-02


Estimates for today:
 resistance (R1 / R2 / R3 = 1.37844 / 110/723),
 Support (S1 / S2 / S3 = 1.37419 / 026 / 1.36830).
The key resistance levels (1 st from 1.38136 to 1.37475 at the end of the day, 2nd from 1.38740 to 1.38220).
The OsMa indicator marked the growth of the activity of the bulls at breakdown (down H1 broken).
 Given the state of the OB oscillators of Stochastics, we expect a test level (up D1 broken / key resistance levels / down H1 broken / EMA24), where it is recommended to consider the activity of the parties on the charts of smaller timeframes.

EURUSD intraday forecast (technical side) 2018-03-02


Settlement levels today:
 resistance (R1 / R2 / R3 = 1.22785 / 1.23068 / 526),
Support (S1 / S2 / S3 = 1.21869 / 516/128).
Key support levels (1 st from 1.22663 to 1.22140 at the end of the day, 2nd from 1.22105 to 1.22140).
The OsMa indicator marked a significant increase in the activity of the bulls at breakdowns of the key levels and (down H4 broken), which provides a basis for the planning of trade transactions correction ..
Given the state of the OB oscillators of Stochastics, we expect a level test (R1 / down H4 broken / EMA120 / S2W1 broken), where it is recommended to consider the activities of the parties on the charts of smaller timeframes.

USDCHF intraday forecast (technical side) 2018-03-02


Calculation levels:
resistance (R1 / R2 / R3 = 0.94684 / 874 / 0.95182),
Support (S1 / S2 / S3 = 0.94067 / 0.93877 / 568).
The key resistance levels (1 st from 0.94073 to 0.94366 at the end of the day, 2nd from 0.94303 to 0.94493).
The OsMa indicator marked the growth of bears' activity.
Given the state of the Stochastics oscillators, expect a level test (S1 / EMA522 / S2), where it is recommended to consider the activities of the parties on the charts of smaller timeframes.

USDJPY intraday forecast (technical side) 2018-03-02


Calculation levels:
resistance (R1 / R2 / R3 = 106.903 / 107.169 / 598),
support (S1 / S2 / S3 = 106,045 / 105,779 / 350).
The key resistance levels (1 st from 106,938 to the end of the day, 2nd from 107,112 to).
The OsMa indicator signaled a significant increase in the bear-side activity during testing (EMA120, key resistance levels), and a breakdown (up H4 broken).
Given the orientation of the Stochastics oscillators, expect a level test (S1 / S2), where it is recommended to consider the activity of the parties on the charts of smaller timeframes.

GBPUSD intraday forecast (technical side) 2018-03-01


Estimates for today:
 resistance (R1 / R2 / R3 = 1.38693 / 1.39086 / 723),
 Support (S1 / S2 / S3 = 1.37419 / 026 / 1.36389).
The key resistance levels (1 st from 1.39119 to 1.38136 at the end of the day, 2nd from 1.39629 to 1.38740).
The OsMa indicator marked the breeding activity of the bears at breakdown (up D1 broken), but also confirmed the divergence. This provides the basis for planning trade corrections and for today.
 Given the state of the Stochastics oscillators, we expect a level test (down H1 / EMA24), where it is recommended to consider the activities of the parties in the charts of smaller timeframes.