weekly forecast (technical side)

GBPUSD weekly forecast (technical side) 2018-06-(11-15)

понеділок, 5 лютого 2018 р.

GBPUSD intraday forecast (technical side) 2018-02-06

Estimates for today:
 support (S1 / S2 / S3 = 1.39316 / 1.38825 / 030),
 resistance (R1 / R2 / R3 = 1.40906 / 1.41397 / 1.42192).
Key levels arepossible (1 st from 1.41757 to 1.40635 at the end of the day, 2nd from 1.41889 to 1.41317).
The OsMa indicator marked divergence and lowered the bearish activity, providing a basis for planning trade corrections.
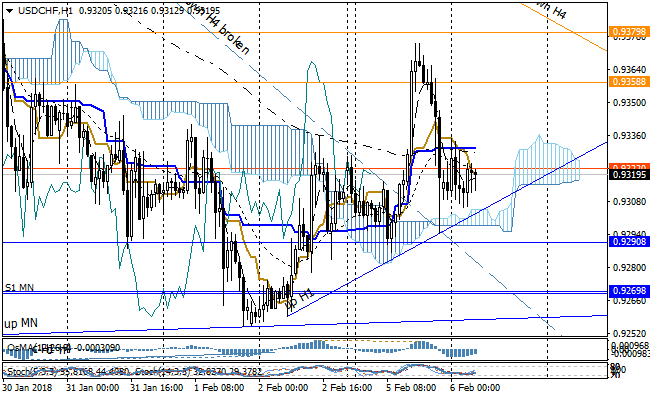
Given the state of the Stochastics oscillators, expect a test (EMA24, down H1 or EMA522, S1), where it is recommended to consider the activity of the parties on the charts of smaller timeframes.
For sales from down H1, or if the rate falls below S1 targets may be equal (S2, S3).
For alternative short-term purchases of correction, with the condition of forming a reversal from (S1, EMA522), the target levels are: (level down H1, R1, R2, key resistance levels, up H4 broken).

Compiled according to the trading platform MT4 from AVATRDE.com


USDJPY intraday forecast (technical side) 2018-02-06

Calculation levels:
support (S1 / S2 / S3 = 108,941 / 640/153), support (R1 / R2 / R3 = 109.914 / 110.215 / 701).
The key resistance levels (1 st from 109,732 to 109,626 at the end of the day, 2nd from 110,055 to 109,727).
The OsMa indicator marked the growth of bears' activity.
Given the state of the Stochastics Oscillators, expect a S2, S3, down H1 test, where it is recommended to consider the activity of the parties on the charts of smaller timeframes.

Compiled according to the trading platform MT4 from AVATRDE.com

More details of analysis & forecast : https://www.mql5.com/en/users/bi0l/blog

USDCHF intraday forecast (technical side) 2018-02-06

Calculation levels:
support (S1 / S2 / S3 = 0.92908 / 698/358), resistance (R1 / R2 / R3 = 0.93588 / 798 / 0.94138).
Key support levels (1 st from 0.93026 to 0.93329 at the end of the day, 2nd from 0.92978 to 0.93151).
The OsMa indicator marked fluctuations in the activity of the parties, which is the basis for the planning of trading transaction corrections for today.
Given the state of the Stochastics oscillators, we expect the EMA24, EMA120, up H1 and key levels to test the parties' performance in smaller timetable charts.

More details of analysis & forecast
https://www.mql5.com/en/users/bi0l/blog
or through personal appeal (oleksa.bilokon@gmail.com)

EURUSD intraday forecast (technical side) 2018-02-06

Settlement levels today:
support (S1 / S2 / S3 = 1,23578 / 313 / 1.22885), resistance (R1 / R2 / R3 = 1.24433 / 697 / 1.25125).
The key resistance levels (1 st from 1.24531 to 1.24245 at the end of the day, 2nd from 1.24562 to 1.24544).
The OsMa indicator marked the decline in the bear-side activity, which provides the basis for the planning of trading transaction corrections for today.
Given the state of the Stochastics oscillators, expect a level test (S1), where it is recommended to consider the activity of the parties on the charts of smaller timeframes.

More details of analysis & forecast
https://www.mql5.com/en/users/bi0l/blog
or through personal appeal (oleksa.bilokon@gmail.com)