weekly forecast (technical side)

GBPUSD weekly forecast (technical side) 2018-06-(11-15)

середа, 30 березня 2016 р.

#BRENT intraday forecast (technical side) 2016-03-31


Calculated level for today:
Support (S1 / S2 / S3 = 39,83 / 39,48 / 38,93), resistance (R1 / R2 / R3 = 40,94 / 41,29 / 41,85).
Key resistance levels (1st from 40.13 to 40.48 at the end of the day, the 2nd of 40.48 to 41.51).
Indicator OsMa bears marked increase in activity late last trading day, which provides a basis for planning of trading operations for today and correction.

More details of analysis & forecast : 

USDJPY intraday forecast (technical side) 2016-03-31

Calculated data levels:
Support (S1 / S2 / S3 = 112,11 / 111,92 / 111,62), resistance (R1 / R2 / R3 = 112,71 / 90 / 113.20).
Key resistance levels (1st from 113.17 to 112.45 at the end of the day, the 2nd of 113.19 to 112.90).
OsMa marked divergence indicator and the corresponding increase in the activity of bulls, which is the basis for planning of trading correction.

More details of analysis & forecast : 

GBPUSD intraday forecast (technical side) 2016-03-31

Calculated level for today:
 Support (S1 / S2 / S3 = 1,4360 / 37 / 1.4299) and resistance (R1 / R2 / R3 = 1,4436 / 59/97).
Key support levels (1st from 1.4315 to 1.4209 late in the day, the 2nd of 1.4261 to 1.4195).
OsMa indicator marked increase in activity bears, after testing levels (S1-m), which provides the basis for planning of trading operations for today and correction.

More details of analysis & forecast : 

USDCHF INTRADAY FORECAST (TECHNICAL SIDE) 2016-03-31

Estimated level:
Support (S1 / S2 / S3 = 0,9606 / 0x9588 / 0,9558), resistance (R1 / R2 / R3 = 0,9667 / 85 / .9716).
Key resistance levels (1st from 0.9708 to 0.9629 late in the day, the 2nd of 0.9721 to 0.9676).
OsMa marked divergence indicator and bulls increased activity late last trading day, which is the basis for planning of trading operations benefit from correction of shopping today.

More details of analysis & forecast : 

EURUSD intraday forecast (technical side) 2016-03-31

Calculated levels today:
Support (S1 / S2 / S3 = 1,1297 / 78/46), resistance (R1 / R2 / R3 = 1.1360 / 1,1379 / 1,1410).
Key support levels (1st from 1.1238 to 1.1326 late in the day, the 2nd of 1.1227 to 1.1267).
Indicator OsMa noted reduced activity breakdown levels for bulls (Down W1 broken), which provides the basis for planning trading operations for today correction.

More details of analysis & forecast : 

XAUUSD intraday forecast (technical side) 2016-03-31

Calculated level for today:
Support (S1 / S2 / S3 = 1222,61 / 1217,66 / 1209,64), resistance (R1 / R2 / R3 = 1238,66 / 1243,61 / 1251,64).
Key level (1st from 1225.35 to 1229.63 at the end of the day, the 2nd of 1229.41 to 1232.10).
Indicator OsMa marked increase in activity bears to return to key levels, which is the basis for planning trading operations for today correction.

More details of analysis & forecast : 


вівторок, 29 березня 2016 р.

#BRENT intraday forecast (technical side) 2016-03-30

Calculated level for today:
Support (S1 / S2 / S3 = 39,56 / 39,23 / 38,70), resistance (R1 / R2 / R3 = 40,61 / 40,94 / 42,21).
Key resistance levels (1st from 40.75 to 40.13 at the end of the day, the 2nd of 41.05 to 40.48).
Indicator OsMa bears marked decrease in activity late last trading day, which provides a basis for planning trading operations for today correction.

More details of analysis & forecast : 


XAUUSD intraday forecast (technical side) 2016-03-30

Calculated level for today:
Support (S1 / S2 / S3 = 1222,79 / 1216,26 / 1211,29), resistance (R1 / R2 / R3 = 1243,89 / 1250,42 / 1260,97).
Key level (1st from 1216.36 to 1229.41 at the end of the day, the 2nd ox 1217.35 to 1225.35).
Indicator OsMa noted a sharp increase in activity in bulls breakdown and key levels (EMA521), is providing the basis for planning of trading operations with advantage correction shopping today.

More details of analysis & forecast : 

EURUSD intraday forecast (technical side) 2016-03-30

Calculated levels today:
Support (S1 / S2 / S3 = 1,1202 / 1,1171 / 1,1120), resistance (R1 / R2 / R3 = 1.1305 / 1,136 / 1,1388).
Key support levels (1st from 1.1187 to 1.1238 late in the day, the 2nd of 1.1185 to 1.1227).
Indicator OsMa noted rizkezrostannya activity bulls on monthly breakdown (R1-m) and weekly (R1-w) resistance levels, which provides a basis for planning of trading operations benefit from correction of shopping today.

More details of analysis & forecast : 

USDCHF intraday forecast (technical side) 2016-03-30

Estimated level:
Support (S1 / S2 / S3 = 0,9654 / 29 / 0.9589) and resistance (R1 / R2 / R3 = 0,9734 / 59/99).
Key resistance levels (1st from 0.9750 to 0.9721 late in the day, the 2nd of 0.9753 to 0.9708).
The sharp increase in activity bears that marked the indicator on OsMa breakdown levels (S1-m, up H4) and S1-w, prefer to plan sales and trading operations for today.

More details of analysis & forecast : 


GBPUSD intraday forecast (technical side) 2016-03-30

Calculated level for today:
 Support (S1 / S2 / S3 = 1,4247 / 1,4198 / 18), resistance (R1 / R2 / R3 = 1,4376 / 1,4406 / 1,4536).
Key support levels (1st from 1.4209 to 1.4315 late in the day, the 2nd of 1.4195 to 1.4261).
Sharp, increased activity of bulls that marked the indicator OsMa after rollback of slain levels (EMA521,120), but the increase in activity was insufficient (divergence), which provides the basis for planning trading operations for today correction.

More details of analysis & forecast : 

USDJPY intraday forecast (technical side) 2016-03-30

Calculated data levels:
Support (S1 / S2 / S3 = 112,58 / 29 / 111.84) and resistance (R1 / R2 / R3 = 113,48 / 77 / 114.22).
Key resistance levels (1st from 113.04 to 113.17 at the end of the day, the 2nd of 113.19 to 112.19).
Indicator OsMa marked increase in activity in bulls breakdown and key levels (up H1 broken) when tested (up H4 broken), which is the basis for planning of trading operations correction dominated sales.

More details of analysis & forecast : 

USDJPY intraday forecast (technical side) 2016-03-29


Calculated data levels:
Support (S1 / S2 / S3 = 113,21.09 / 112,88), resistance (R1 / R2 / R3 = 113,63 / 75/96).
Key support levels (1st from 113.03 to 113.35 at the end of the day, the 2nd of 112.80 to 113.16).
Indicator OsMa marked increase in activity when tested bulls (up H4 broken), and bears during testing R1-w, which is the basis for planning of trading correction.

More details of analysis & forecast : 

GBPUSD intraday forecast (technical side) 2016-03-29

Calculated level for today:
 Support (S1 / S2 / S3 = 1,4155 / 16 / 1.4054) and resistance (R1 / R2 / R3 = 1,4279 / 1,4318 / 1,4380).
Key support levels (1st from 1.4138 to 1.4209 late in the day, the 2nd of 1.4119 to 1.4195).
Growing activity of bulls that marked the indicator OsMa after breakdown (down H4 broken), provides the basis for planning of trading operations benefit from correction of shopping and today.

More details of analysis & forecast : 

USDCHF intraday forecast (technical side) 2016-03-29

Estimated level:
Support (S1 / S2 / S3 = 0,9724 / 08 / 0.9684) and resistance (R1 / R2 / R3 = 0,9772 / 0,9788 / 0,9812).
Key resistance levels (1st from 0.9758 to 0.9750 late in the day, the 2nd of 0.9769 to 0.9753).
Growing activity of bears that marked the indicator OsMa, on trial key levels, (up H4) and S1-m, and the formation of the trend (down H4) prefer to plan sales trading today.

More details of analysis & forecast : 

EURUSD intraday forecast (technical side) 2016-03-29


 Calculated levels today:
Support (S1 / S2 / S3 = 1,1163 / 1,1147 / 1,1121), resistance (R1 / R2 / R3 = 1.1214 / 1,1230 / 1,1255).
Key support levels (1st from 1.1168 to 1.1187 late in the day, the 2nd of 1.1165 to 1.1185).
Indicator OsMa marked increase in activity of bulls, which provides the basis for planning of trading operations benefit from correction of shopping today.

More details of analysis & forecast : 

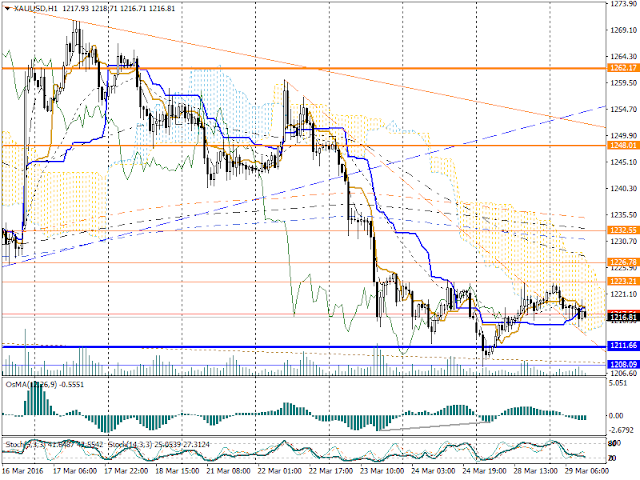
XAUUSD intraday forecast (technical side) 2016-03-29

Calculated level for today:
Support (S1 / S2 / S3 = 1211,66 / 1208,09 / 1202,31), resistance (R1 / R2 / R3 = 1223,21 / 1226,78 / 1232,55).
Key level (1st from 1219.25 to 1216.36 at the end of the day, the 2nd ox 1234.45 to 1217.35).
Indicator OsMa marked increase in activity of bulls in the sample (down H1 broken) and decrease in activity late last trading day that prefers to plan trading correction today.

More details of analysis & forecast : 


понеділок, 28 березня 2016 р.

#BRENT intraday forecast (technical side) 2016-03-29

Calculated level for today:
Support (S1 / S2 / S3 = 40,29 / 39,97 / 39,45), resistance (R1 / R2 / R3 = 41,34 / 41,66 / 42,19).
Key resistance levels (1st from 40.66 to 40.75 at the end of the day, the 2nd of 41.20 to 41.05).
Indicator OsMa marked decrease in activity of the bulls at testing key levels and increased activity of bears, with a maximum in testing (down H4 broken), which provides a basis for planning of trading sales advantage adjustment for today.

More details of analysis & forecast : 
пʼятниця, 18 березня 2016 р.

EURUSD intraday forecast (technical side) 2016-03-18

Calculated levels today:
Support (S1 / S2 / S3 = 1.1235 / 1,1202 / 1,1150), resistance (R1 / R2 / R3 = 1,1339 / 1,1372 / 1,1424).
Key support levels (1st from 1.1149 to 1.1287 late in the day, the 2nd of 1.1149 to 1.1200).
OsMa vidyityv divergence indicator and vedmeliv increased activity, providing a basis for planning trading operations for today correction.

More details of analysis & fortcast : 

XAUUSD intraday forecast (technical side)


 Calculated level for today:
Support (S1 / S2 / S3 = 1254,67 / 1250,78 / 1244,48), resistance (R1 / R2 / R3 = 1267,27 / 1271,16 / 1277,46).
Key support levels (1st from 1244.03 to 1256.33 at the end of the day, the 2nd ox 1243.60 to 1248.56).
Indicator OsMa bears marked increase in activity late last trading day, and lower activity levels in testing key avdtrymky that prefers to plan trading correction today.

More details of analysis & fortcast : 

#BRENT intraday forecast (technical side) 2016-03-18


Calculated level for today:
Support (S1 / S2 / S3 = 41,12 / 40,84 / 30,39), resistance (R1 / R2 / R3 = 42,01 / 42,29 / 42,73).
Key support levels (1st from 39.84 to 40.33 at the end of the day, the 2nd of 39.70 to 40.13).
OsMa marked divergence indicator and decrease of bulls on test (R1-w broken), which provides a basis for planning of trading sales advantage adjustment for today.

More details of analysis & fortcast : 


четвер, 17 березня 2016 р.

#BRENT intraday forecast (technical side) 2016-03-17

Calculated level for today:
Support (S1 / S2 / S3 = 39,62 / 24 / 38.63) and resistance (R1 / R2 / R3 = 40,84 / 41,22 / 83).
Key support levels (1st from 39.98 to 39.91 at the end of the day, the 2nd of 39.21 to 39.70).
Alternative purchases implemented. The indicator increased activity OsMa prefer to sample (down H1 broken, key levels and down H4,), which favors trading for planning and correction today.

More details of analysis & fortcast : 


середа, 16 березня 2016 р.

GBPUSD intraday forecast (technical side) 2016-03-16

Calculated level for today:
 Support (S1 / S2 / S3 = 1,4135 / 1,4095 / 32), resistance (R1 / R2 / R3 = 1,4261 / 1,4301 / 64).
Key support levels (1st from 1.4316 to 1.4194 late in the day, the 2nd of 1.4344 to 1.4272).
Growing activity of bears that OsMa indicator pointed to breakdowns (Up H1 broken, S1-w broken), provides the basis for planning of trading operations for today advantage correction sale.

More details of analysis & fortcast : 

EURUSD intraday forecast (technical side) 2016-03-16

Calculated levels today:
Support (S1 / S2 / S3 = 1.1080 / 67/47), resistance (R1 / R2 / R3 = 1.1120 / 33/53).
Key level (1st from 1.1116 to 1.1100 late in the day, the 2nd of 1.1147 to 1.1125).
 Indicator OsMa noted reduced activity of the parties, providing a basis for planning of trading correction.

More details of analysis & fortcast : 

USDCHF intraday forecast (technical side) 2016-03-16

Calculated levels today:
Support (S1 / S2 / S3 = 0,9852 / 41/23), resistance (R1 / R2 / R3 = 0,9888 / 99 / .9917).
Key support levels (1st from 0.9853 to 0.9868 late in the day, the 2nd of 0.9845 to 0.9848).
Reduced activity of the parties noted OsMa indicator, provides the basis of planning of trading correction.

More details of analysis & fortcast : 


USDJPY intraday forecast (technical side) 2016-03-16

Calculated data levels:
Support (S1 / S2 / S3 = 112,74 / 38 / 111.80) and resistance (R1 / R2 / R3 = 113,90 / 114,26 / 84).
Key resistance levels (1st from 113.30 to 113.14 at the end of the day, the 2nd of 113.73 to 113.38).
Indicator OsMa marked increase in activity bears the sample (Up H1 broken), which is the basis for planning of trading operations for sale.

More details of analysis & fortcast : 


вівторок, 15 березня 2016 р.

XAUUSD intraday forecast (technical side) 2016-03-16

Calculated level for today:
Support (S1 / S2 / S3 = 1227,71 / 1224,29 / 1219,58), resistance (R1 / R2 / R3 = 1236,63 / 1239,55 / 1244,26).
Key resistance levels (1st from 1244.56 to 1233.94 at the end of the day, the 2nd ox 1255.92 to 1245.94).
Indicator OsMa marked decrease in activity of bears and bulls increased activity, providing a basis adjustment planning trading operations for today.

More details of analysis & fortcast : 


#BRENT intraday forecast (technical side) 2016-03-16

Calculated level for today:
Support (S1 / S2 / S3 = 38,82 / 49 / 37.95) and resistance (R1 / R2 / R3 = 39,8 / 40,22 / 75).
Key resistance levels (1st from 40.03 to 39.21 at the end of the day, the 2nd of 40.23 to 39.98).
Indicator OsMa marked decrease in activity bears during testing of R1-m broken, providing a basis for planning of trading operations for correction of advantage.

More details of analysis & fortcast : 

понеділок, 14 березня 2016 р.

#BRENT intraday forecast (technical side) 2016-03-15

Calculated level for today:
Support (S1 / S2 / S3 = 39,36 / 38,97 / 33), resistance (R1 / R2 / R3 = 40,64 / 41,03 / 67).
Key resistance levels (1st from 40.63 to 39.95 at the end of the day, the 2nd of 40.70 to 40.23).
Indicator OsMa marked increase in activity in the sample bears Up H4, which provides the basis for planning of trading operations for correction of advantage.

More details of analysis & fortcast : 

USDJPY intraday forecast (technical side) 2016-03-15

Calculated data levels:
Support (S1 / S2 / S3 = 113,57 / 45/26), resistance (R1 / R2 / R3 = 113,95 / 114,07 / 26).
Key support levels (1st from 113.52 to 113.73 at the end of the day, the 2nd of 113.45 to 113.30).
Indicator OsMa noted reduced activity of the parties ,, which is the basis for planning of trading correction.

More details of analysis & fortcast : 

USDCHF intraday forecast (technical side) 2016-03-15

Calculated levels today:
Support (S1 / S2 / S3 = 0,9811 / 16 / 0.9792) and resistance (R1 / R2 / R3 = 0,9880 / 95 / .9920).
Key resistance levels (1st from 0.9840 to 0.9845 late in the day, the 2nd of 0.9946 to 0.9853).
Reduced activity of the parties noted OsMa indicator, provides the basis of planning of trading correction.

More details of analysis & fortcast :